 ReddRadar
Customizable data visualization tools - AI tools
-
 Exploring Data Interactive Data Visualizations with Open Data and Open Source Tools
Exploring Data is a platform showcasing interactive data visualizations created using open data and open source tools, featuring various network graphs, 3D globes, and geographic maps.
- Free
-
 Datawrapper Create better charts, maps, and tables with ease
Datawrapper is a powerful web application that enables users to design and publish high-quality data visualizations, including charts, maps, and tables, with professional and accessible results.
- Freemium
- From 599$
-
 welcome.calcgen.ai Build Beautiful, Interactive, Customizable Data Visuals in Seconds
CalcGen uses a swarm of AI agents to automatically research, analyze, and create interactive, customizable data visualizations from a single prompt.
- Paid
- From 10$
-
 Datacopia Effortless Data Visualization for Everyone
Datacopia enables users to effortlessly generate a wide variety of charts and graphs from their data, streamlining data analysis and visualization tasks.
- Other
-
 Visual.is Create beautiful and dynamic data visualizations easily
Visual.is is an AI-powered platform that enables users to create professional reports, charts, and dashboards without technical expertise, offering user-friendly tools with beautiful design templates.
- Freemium
- From 8$
-
 ApexCharts Modern & Interactive Open-source Charts for Developers
ApexCharts is an open-source charting library that enables developers to create beautiful, interactive data visualizations for web applications with extensive API documentation and multiple chart types.
- Freemium
- From 17$
-
 Avanzai Talk Data, See Charts
Avanzai is an AI-powered data visualization platform that transforms complex market analysis into interactive charts through natural language processing, supporting both built-in financial data and custom datasets.
- Contact for Pricing
-
 FusionCharts Build interactive, responsive, and beautiful JavaScript charts for any framework
FusionCharts provides high-performance JavaScript charting libraries for creating interactive, responsive charts and dashboards across frameworks like React, Vue, Angular, and pure JavaScript, trusted by over 800,000 developers.
- Free Trial
-
 InstaCharts Instant Data Visualization and Smart Chart Creation
InstaCharts is an intuitive data visualization tool that uses smart technology to automatically generate interactive charts and tables from your spreadsheet data. Easily create, customize, share, and embed compelling visualizations for reports, websites, and data exploration.
- Freemium
- From 10$
-
 SnappyCharts Create stunning charts in minutes with no coding required
SnappyCharts is a no-code, web-based solution that transforms data into beautiful, responsive charts quickly and easily.
- Freemium
- From 10$
-
 DataGIF.io Transform Your Data into Engaging Animated GIFs
DataGIF.io is an AI-powered tool that transforms data from CSV or Excel files into animated charts for social media, websites, and presentations.
- Usage Based
-
 Insiderviz AI-powered data visualization platform
Insiderviz is an AI tool for creating interactive data visualizations and insights from complex datasets.
- Other
-
 My Little Chart Rapid, Beautiful Chart Creation with Real-Time Data Sync
My Little Chart enables analysts and creatives to swiftly generate customizable, visually engaging charts and graphs, synchronizing data in real time for impactful presentations and seamless integration. Enjoy easy data imports, broad personalization, and effortless embedding across modern platforms.
- Freemium
- From 2$
-
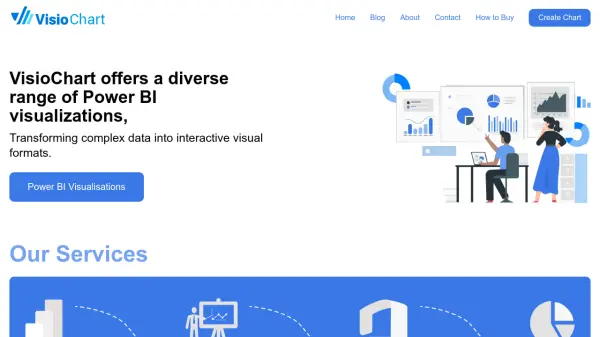 VisioChart Transforming complex data into interactive visual formats.
VisioChart offers a diverse range of Power BI visualizations to transform complex data into interactive visual formats, enabling users to create engaging charts without coding or design skills.
- Contact for Pricing
-
 Orange Data Mining Open source machine learning and data visualization.
Orange Data Mining is an open-source tool offering visual programming for machine learning and interactive data visualization, simplifying data analysis without coding.
- Free
-
 ImgCharts Free Chart Maker for Amazing Visualizations
ImgCharts is a free online chart maker that enables users to create various types of charts instantly without requiring sign-up, offering a user-friendly interface for data visualization.
- Free
-
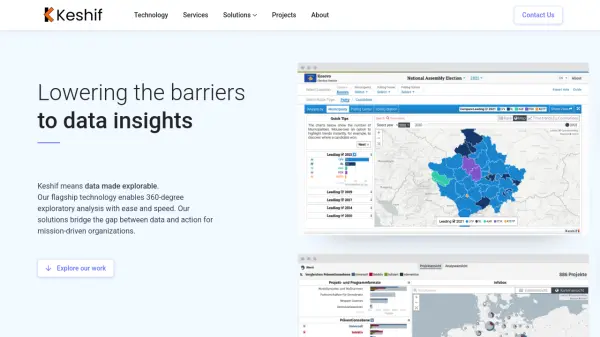 Keshif Data made explorable with 360-degree exploratory analysis
Keshif is an AI-powered visual data analytics platform that transforms tables and databases into interactive dashboards and charts for rapid exploratory analysis.
- Contact for Pricing
-
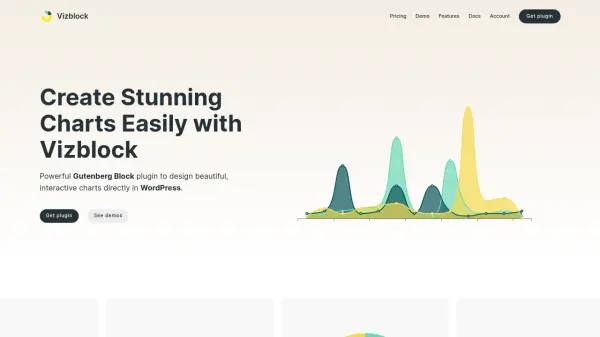 Vizblock Powerful Gutenberg Block plugin to design beautiful, interactive charts directly in WordPress
Vizblock is a WordPress Gutenberg block plugin that enables users to create stunning, interactive charts with an intuitive drag-and-drop interface, no coding required.
- Pay Once
-
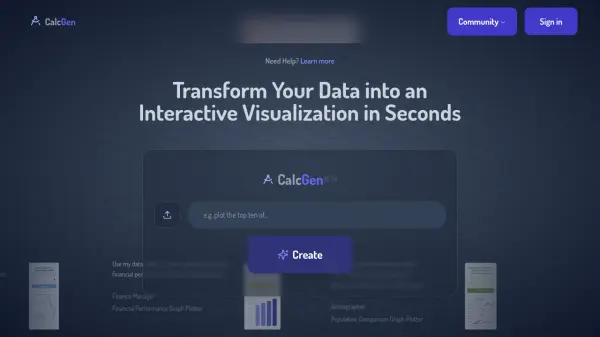 CalcGen Transform Your Data into an Interactive Visualization in Seconds
CalcGen is a tool that instantly generates interactive visualizations and calculators from user-provided data or conceptual prompts.
- Free
-
 Chartworks Complex financial data made beautiful. Everywhere.
Chartworks provides interactive HTML5 charts, image-based charts, and mobile SDKs for visualizing complex financial data across web, mobile, and various platforms with responsive design and easy integration.
- Contact for Pricing
-
 haystack.design Unlimited Custom Data Visualizations on Demand
Haystack offers a subscription-based service for unlimited custom data visualizations, including charts, graphs, maps, and infographics, tailored to your specific needs. Streamline your data storytelling with rapid turnaround, expert design, and unlimited revisions.
- Paid
- From 2995$
-
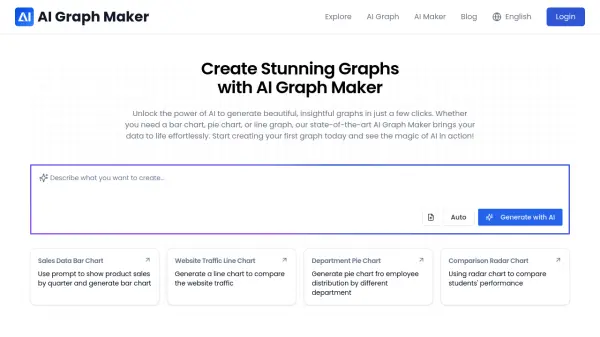 AI Graph Maker Create Stunning Graphs with AI
AI Graph Maker uses AI to generate various types of insightful graphs, including bar charts, pie charts, and line graphs. Start creating data visualizations effortlessly.
- Free
-
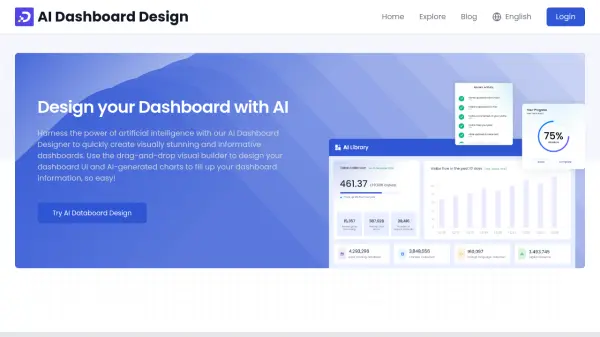 AI Dashboard Design Design your Dashboard with AI
AI Dashboard Design uses artificial intelligence to help users create visually stunning and informative dashboards quickly with a drag-and-drop builder and AI-generated charts.
- Freemium
-
 MakeCharts Visualize Complexity into Clarity
MakeCharts is an AI-powered visualization tool that transforms data, ideas, and plans into clear, shareable visuals including charts, diagrams, timelines, and frameworks in minutes.
- Freemium
- From 7$
-
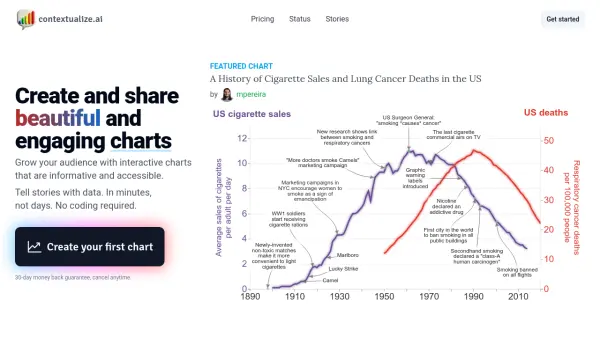 contextualize.ai Tell stories with data. In minutes, not days. No coding required.
Contextualize.ai enables users to create and share interactive, annotated charts to tell compelling stories with data quickly and without coding, featuring AI-powered insights.
- Freemium
- From 19$
-
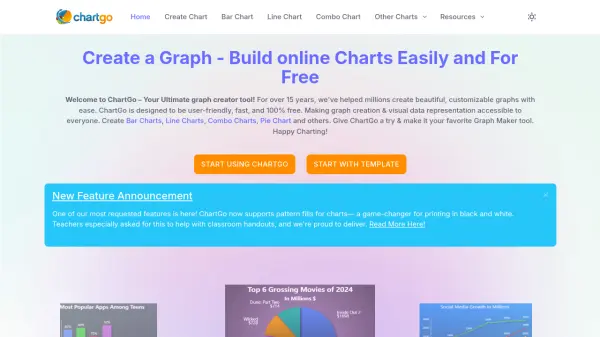 ChartGo Create Professional Charts Online for Free
ChartGo is a free online tool designed to help users easily create, customize, and export a wide range of chart types, making data visualization accessible for everyone.
- Free
-
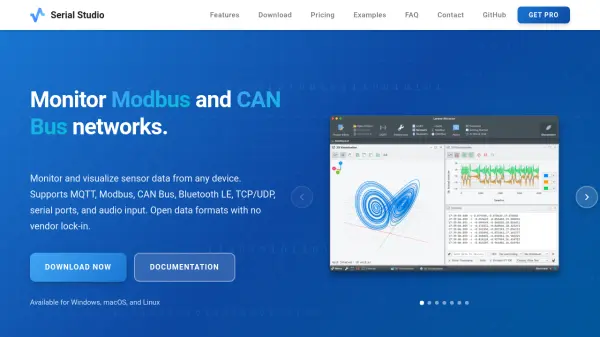 Serial Studio Real-time data visualization for embedded systems and IoT devices
Serial Studio is a cross-platform data visualization application that provides real-time dashboards for monitoring embedded systems, IoT devices, and industrial automation networks through multiple communication protocols.
- Freemium
- From 10$
-
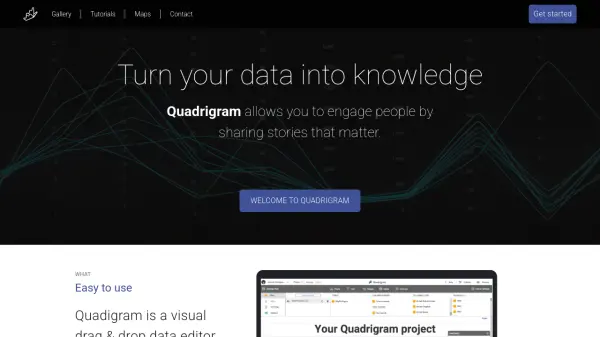 Quadrigram Turn your data into knowledge with interactive visualizations
Quadrigram is a visual drag-and-drop data editor that transforms data into engaging stories through interactive visualizations, combining texts, images, and charts without coding skills.
- Freemium
- From 20$
-
 Bin Data to dashboards in seconds.
Bin is an AI business intelligence analyst that transforms complex data into stunning visualizations and interactive dashboards using natural language descriptions, eliminating the need for manual SQL queries or complex BI tools.
- Paid
- From 25$
-
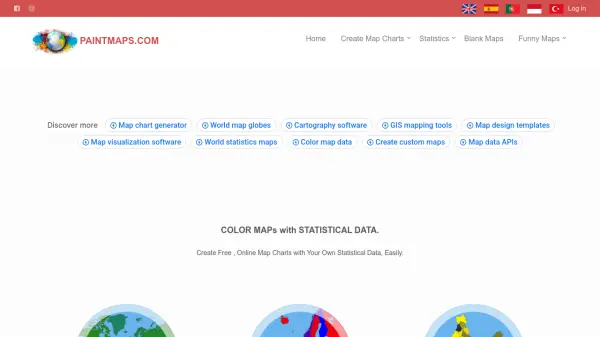 Paintmaps.com Create Free, Online Map Charts with Your Own Statistical Data, Easily
Paintmaps.com is a free online tool for creating interactive map charts with statistical data visualization, supporting world maps, continent maps, country maps, and more.
- Free
Featured Tools
Join Our Newsletter
Stay updated with the latest AI tools, news, and offers by subscribing to our weekly newsletter.
Explore More
-
AI lyrics generator for musicians 47 tools
-
create ai affiliate articles wordpress 19 tools
-
responsive web design tools 25 tools
-
AI tool for influencer discovery 43 tools
-
Network security and cybersecurity monitoring tools 60 tools
-
technical SEO optimization platform 41 tools
-
AI automation tool for cross-platform tasks 60 tools
-
Custom AI agent development for business 37 tools
-
SMTP service for email marketing 12 tools
Didn't find tool you were looking for?