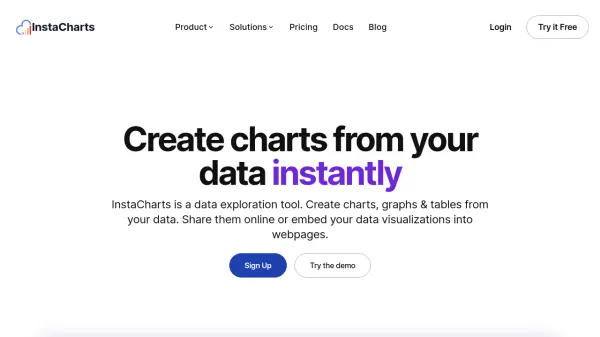
What is InstaCharts?
InstaCharts leverages advanced data detection technology to automate the creation of interactive charts, graphs, and tables from various data sources including spreadsheets, CSV, JSON files, and integrations like Google Sheets and Drive. Designed for efficiency, its intuitive platform detects column types and formatting to streamline the process, allowing users to instantly visualize key insights without manual setup.
The platform supports a range of customizable chart types, supports rich data import options, and embeds seamlessly into webpages and reports. With features like auto-aggregation, smart data recommendations, real-time sharing, export capabilities, and interactive filters, InstaCharts caters to professionals seeking quick, professional-quality data visualizations for analysis, presentations, and collaborative projects.
Features
- Smart Chart Creator: Instantly generates interactive charts and graphs with auto-detected data columns and formats.
- Multiple Chart Types: Supports 13 chart types including line, bar, area, pie, scatterplot, radar, heatmap, and mekko.
- Automatic Data Detection: Identifies dates, currencies, numbers, and recommends chart axis based on data.
- Customizable Charts: Enables users to change chart attributes, filters, axes, color schemes, and text annotations.
- Seamless Integration: Connects with external sources such as Google Sheets, Google Drive, Excel, CSV, and pasted text.
- Embedding and Sharing: Offers public links and embedding of interactive visualizations into websites and reports.
- Export Capabilities: Allows downloading chart images as PNG or SVG and data as CSV, Excel, TSV, or JSON.
- Interactive Features: Includes hover data points, interactive chart legends, quick and multi-column filtering.
- Auto Aggregation: Aggregates data on the fly, supporting different aggregation functions.
- Automation and Scheduling: Integrates with Zapier and supports scheduled sync for connected data sources.
Use Cases
- Creating interactive visualizations for business or research reports.
- Embedding dynamic charts and tables in websites and internal dashboards.
- Sharing data insights with teams via public or private links.
- Automating chart generation from regularly updated spreadsheets.
- Quickly exploring datasets to identify trends, outliers, and actionable insights.
- Providing visual data summaries in publications or management presentations.
- Exporting chart images and tables for offline use in documentation or presentations.
- Analyzing and presenting large datasets from various spreadsheet formats.
FAQs
-
What types of charts can I create with InstaCharts?
InstaCharts supports 13 chart types, such as line, bar, stacked bar, area, scatterplot, grouped scatterplot, pie, radar, heatmap, mekko, and data tables with filter and sort options. -
Is InstaCharts truly free to use?
InstaCharts offers a free tier allowing up to 500 rows per sheet with watermarked charts. Paid subscriptions remove these limitations and increase processing and sharing capacities. -
What data formats are supported for upload?
Supported formats include CSV, Excel, TSV, PSV, LOG, JSON, and JSON lines, along with direct integration from Google Sheets and Google Drive. -
Can I embed charts and tables into my website?
Yes, InstaCharts enables embedding of interactive charts and data tables into webpages with view limits based on the subscription plan. -
What happens to my data if I cancel my subscription?
Your data remains accessible within the restrictions of the free tier plan.
Related Queries
Helpful for people in the following professions
Featured Tools
Join Our Newsletter
Stay updated with the latest AI tools, news, and offers by subscribing to our weekly newsletter.


