What is Instadeq?
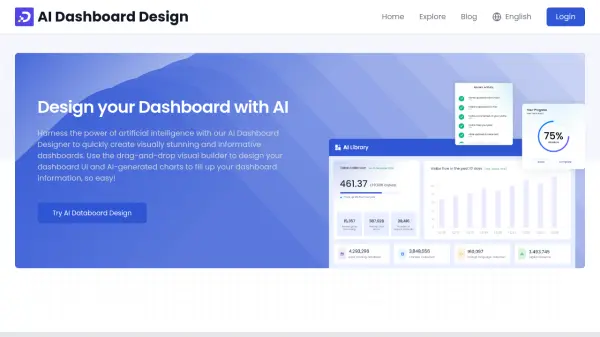
Instadeq provides a solution for data analysis and visualization without requiring coding expertise. It allows users to connect data from diverse sources, including Excel Spreadsheets, Google Sheets, CSV files, JSON files, APIs, and databases, consolidating them into a single environment. The platform emphasizes automation; when new data is loaded, all relevant analysis steps recalculate automatically, ensuring dashboards remain current without manual intervention or refresh intervals.
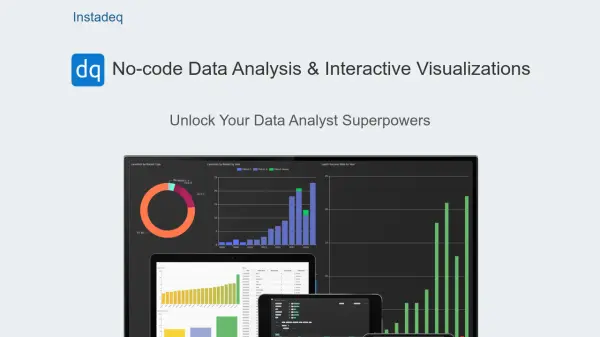
Featuring a drag-and-drop interface with instant feedback, Instadeq facilitates complex data manipulation tasks such as applying formulas, conditions, filters, joins, pivot tables, and column summaries through a visual setup. It also proposes potential next steps in the analysis process. The created dashboards are designed with responsive layouts, making them accessible and functional across various devices like phones, tablets, computers, and TVs through a standard web browser without installation.
Features
- No-code Interface: Drag-and-drop environment with instant feedback for data analysis.
- Automatic Updates: Recalculates steps automatically when new data is loaded.
- Always Current Dashboards: Data stays in sync without manual refreshes or reloads.
- Advanced Data Manipulation: Supports formulas, conditions, filters, joins, pivot tables, and summaries without code.
- AI-Powered Suggestions: Proposes next steps to guide the data analysis process.
- Multiple Data Source Support: Connects Excel, Google Sheets, CSVs, JSON, APIs, and databases.
- Integration Options: Supports direct file uploads and WebHook integrations.
- Responsive Design: Creates dashboards optimized for phones, tablets, computers, and TVs.
- Browser-Based: Accessible through a modern web browser with no installation required.
Use Cases
- Visualizing sales data from Excel spreadsheets.
- Analyzing sports match data from CSV files.
- Sharing dynamic sales reports sourced from Google Spreadsheets.
- Creating real-time dashboards from JSON APIs.
- Updating dashboards programmatically from tools like Google Colab or Jupyter Notebooks.
- Integrating different systems using HTTP Requests via WebHooks.
- Visualizing streaming data from services like PubNub.