What is Sprucely.io?
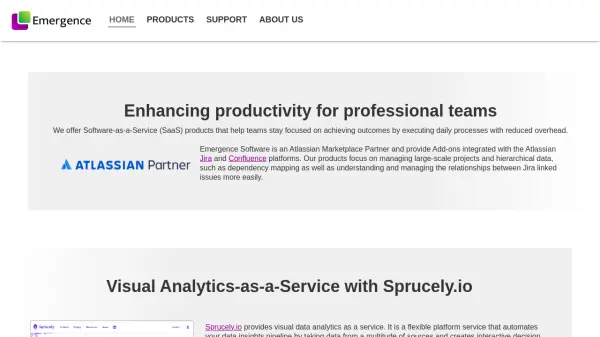
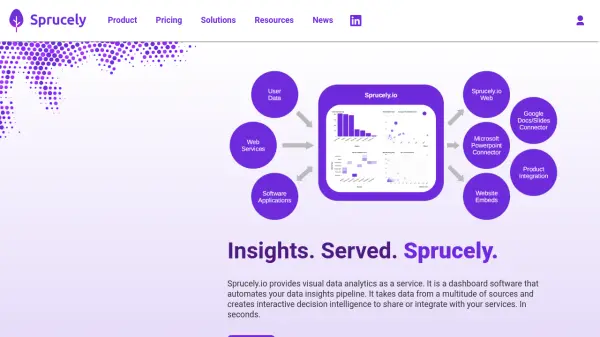
Sprucely.io is a visual data analytics platform delivered as a service, designed to automate the entire data insights pipeline. It connects to various data sources, processes the information, and generates interactive dashboards to facilitate decision intelligence. The platform aims to simplify the process of transforming raw data into clear, visual representations, automatically arranging information to highlight key insights for businesses.
It combines real-time data streaming, data sanitation, extraction, and hybrid cloud management with an integrated dashboard editor. This allows users to quickly customize layouts and themes, incorporating their own branding. The resulting data-driven dashboards can be shared via the web or embedded into documents, presentations, and websites, providing flexibility for both cloud and on-premise deployments while ensuring data confidentiality for sensitive information.
Features
- Automated Data Pipeline: Handles data connection, sanitation, extraction, and dashboard generation automatically.
- Interactive Dashboard Software: Creates dynamic visual reports for data exploration.
- Hybrid Cloud Platform: Supports both cloud (US data residency) and on-premise deployment.
- Visual Dashboard Editor: Allows customization of layout, theme, and branding.
- Automated Data Handling: Features automated detection of data format, data regions, and performs data sanitation.
- Automated Dashboard Generation: Automatically creates layouts, key metrics, and charts.
- Integration Connectors: Offers integration with Microsoft Powerpoint, Google Docs, and Google Slides.
- AI Query Capability: Allows direct text queries to render dashboards (available in paid plans).
- Multiple Data Source Import: Supports files (JSON, Excel, ODS, Parquet, TXT/CSV) and web streams.
- Flexible Sharing Options: Share via direct links, web embeds, image exports, or document integrations.
Use Cases
- Creating interactive business intelligence dashboards.
- Automating data analysis and reporting processes.
- Visualizing complex datasets for easier interpretation.
- Sharing data insights across teams or with stakeholders.
- Embedding live data dashboards into presentations or websites.
- Managing data analytics securely with hybrid cloud options.
- Generating quick insights from raw data sources.