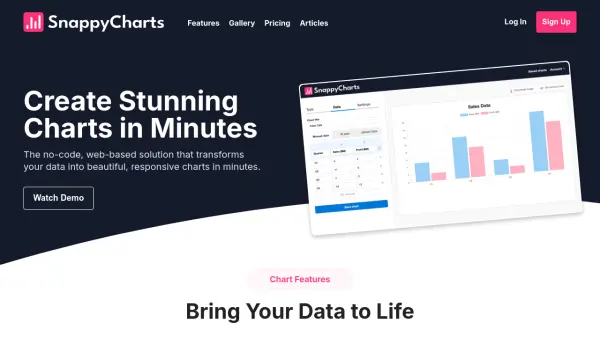
What is My Little Chart?
My Little Chart is a user-friendly chart creation platform designed to help analysts and creative professionals transform raw data into visually compelling charts with minimal effort. The platform emphasizes rapid chart generation, offering an intuitive interface that removes the complexity traditionally associated with graphic data visualization tools. Users can effortlessly connect to popular data sources such as Google Sheets, Airtable, Notion, and CSV files, ensuring their visualizations are always synchronized with current information.
With a strong focus on customization, My Little Chart allows extensive personalization, enabling each chart to be uniquely tailored to the user's aesthetic and communicative needs. The platform supports seamless embedding into websites and integration with presentation software including PowerPoint and Canva, streamlining workflows for business reporting and creative storytelling. Real-time data sync eliminates manual updates, while robust security ensures data integrity and protection throughout the process.
Features
- Real-Time Data Sync: Charts automatically update as source data changes.
- Seamless Integration: Import data from Google Sheets, Airtable, Notion, CSV, and API.
- Easy Embedding: Effortless chart embedding into websites and HTML pages.
- Extensive Personalization: Wide array of customization options for charts to match brand or personal style.
- Presentation Compatibility: Simple export and use in PowerPoint, Keynote, Canva, and other presentation tools.
- User-Friendly Interface: Chart creation and editing in just a few intuitive steps.
- Display Management: Monitor chart views and manage display quotas for usage tracking.
- Secure Data Handling: Daily backups, encrypted credentials, and strict data segregation.
- Annual Display Quotas: Transparent limits and notifications to manage chart usage efficiently.
- Start Without Account: Users can try the service without the need to register.
Use Cases
- Business analysts presenting data-driven insights to stakeholders.
- Marketers visualizing trends for strategy proposals.
- Educators creating compelling classroom visual aids.
- Content creators embedding dynamic charts on blogs and websites.
- Team leads sharing project progress through real-time graphs.
- Consultants preparing high-impact client presentations.
- Startups pitching with data-rich, customized visuals.
- Students generating charts for assignments or research reports.
FAQs
-
Can I embed the same chart in multiple places?
Yes, My Little Chart allows embedding the same graphic in several sites and applications without restriction. -
What happens if I exceed my annual display limit?
You will receive a warning at 90% usage; displays are blocked at 100% until a plan extension is purchased. -
Is monthly payment available for subscriptions?
No, subscriptions are available only on an annual payment basis to avoid additional costs associated with monthly billing. -
Do unused display quotas carry over to the next year?
No, any unused quota expires at the end of your subscription year and does not carry forward. -
Is there a free trial for paid plans?
Yes, the first 30 days are offered as a free trial before payment is required for continued access.