
What is MakeCharts?
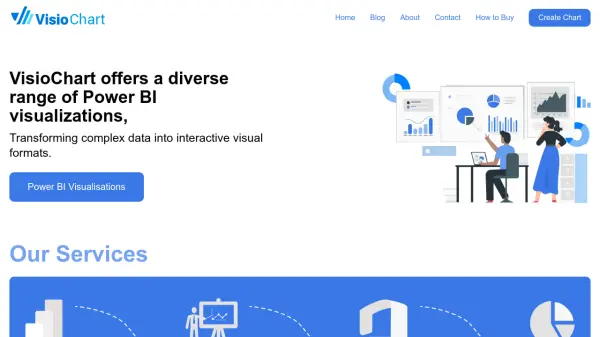
MakeCharts is an AI-powered visualization platform designed to transform complex information into clear, understandable visuals. It enables users to create a wide range of visualizations including charts, diagrams, timelines, maps, and frameworks without requiring design skills. The tool provides polished layouts and smart defaults to ensure professional-looking results.
Teams use MakeCharts to explain insights, share ideas, and align plans through visual communication. It supports various applications from data analysis to strategic planning, making it suitable for creating roadmaps, workflows, org charts, and strategy maps. Users can export visuals in multiple formats including PNG, SVG, and PDF for easy integration into presentations and documents.
Features
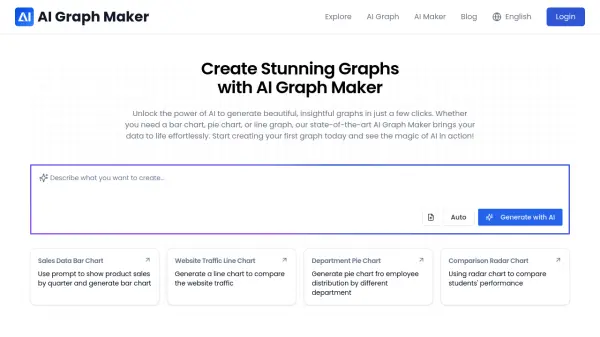
- AI Chart Generation: Automatically create charts using artificial intelligence
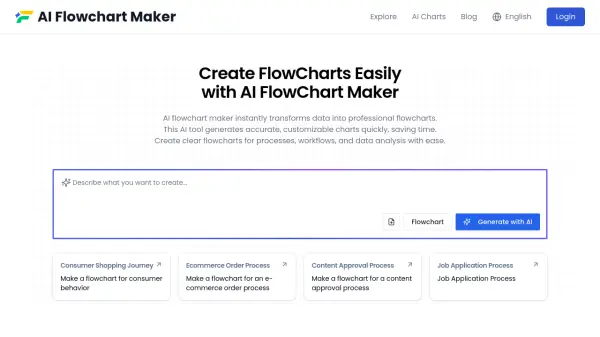
- Multiple Chart Types: Support for diagrams, timelines, maps, frameworks, and more
- Export Options: Download visuals as PNG, SVG, or PDF files
- Data Import: Upload CSV or Excel files and pull data from websites and YouTube
- Smart Layouts: Polished templates and smart defaults for professional results
Use Cases
- Creating data visualizations for presentations and reports
- Developing strategic roadmaps and planning documents
- Designing organizational charts and workflow diagrams
- Building timelines for project management
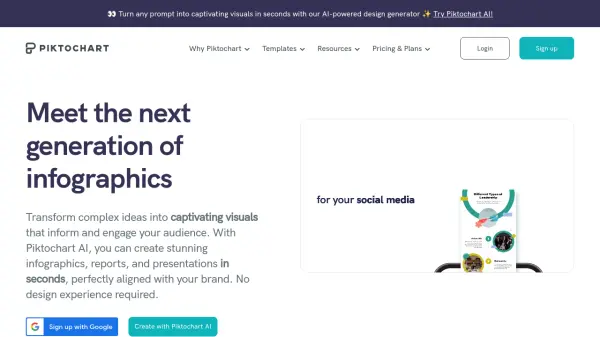
- Creating mind maps and conceptual frameworks
- Explaining complex ideas through visual storytelling
FAQs
-
What types of visuals can I create with MakeCharts?
You can create everything from classic charts to diagrams, mind maps, timelines, flows, roadmaps, org charts, and strategy maps. -
How do I share or export my visuals?
You can export your visuals to PNG, SVG, or PDF formats for use in presentations and documents, or embed them directly into your workflow. -
Do I need design skills to create professional-looking visuals?
No, MakeCharts provides polished layouts and smart defaults so your visuals look clean and professional without requiring design expertise. -
Can I use MakeCharts for planning and communication beyond analytics?
Yes, many teams use MakeCharts for roadmaps, workflows, org charts, and strategy maps to align stakeholders quickly.