What is ChartGo?
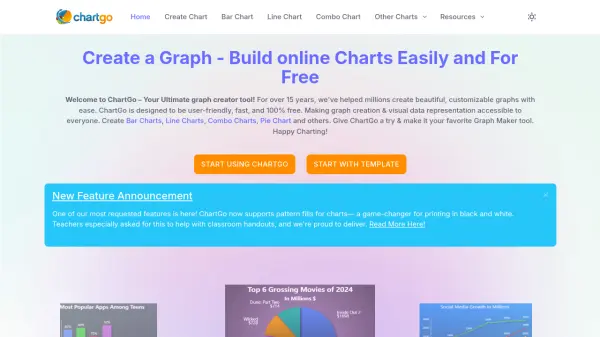
ChartGo provides a user-friendly platform for creating multiple types of charts, including bar, line, combo, pie, and area charts. With a focus on simplicity and efficiency, users can quickly upload data from Excel or CSV files, or paste data directly, and instantly generate vibrant visualizations. The tool is optimized for both beginners and professionals, offering rich customization options such as pattern fills, colors, fonts, sizes, and interactive features like tooltips and trendlines.
ChartGo allows users to export their charts as high-quality images, SVG files, or CSV data, making it easy to integrate visuals into presentations, academic work, and business reports. With no sign-up or subscription required and completely free access, ChartGo stands out as a reliable resource for all data representation needs.
Features
- Variety of Chart Types: Create bar, line, combo, pie, and area charts
- User-Friendly Interface: Simple, fast graph creation accessible to all skill levels
- Data Import: Upload or paste Excel and CSV files directly
- Rich Customization: Adjust chart colors, sizes, fonts, labels, and add interactivity
- Pattern Fills: Supports chart patterns for black and white printing
- Export Options: Download charts as images, SVG, or CSV files
- No Registration Required: Use all features without creating an account
- Completely Free: No hidden charges, subscriptions, or sign-ups
- Templates: Ready-to-use chart templates for quick setup
Use Cases
- Visualizing business or sales reports
- Presenting academic data and research findings
- Creating educational handouts and teaching materials
- Generating charts for presentations and meetings
- Sharing data insights on blogs or social media
- Visualizing trends in marketing analytics
- Quickly prototyping data visuals for collaborative projects
FAQs
-
What types of charts can I create with ChartGo?
ChartGo allows you to create bar, line, combo, pie, and area charts. -
Can I use ChartGo without creating an account?
Yes, ChartGo is completely free to use with no registration required. -
How can I add data to my chart?
You can import data directly from Excel or CSV files, or copy and paste data into ChartGo. -
Can I export my chart for use in presentations?
Yes, charts can be exported as high-quality images, SVG files, or CSV data. -
Is ChartGo suitable for educational purposes?
Absolutely, ChartGo offers pattern fills and templates ideal for teachers and students.