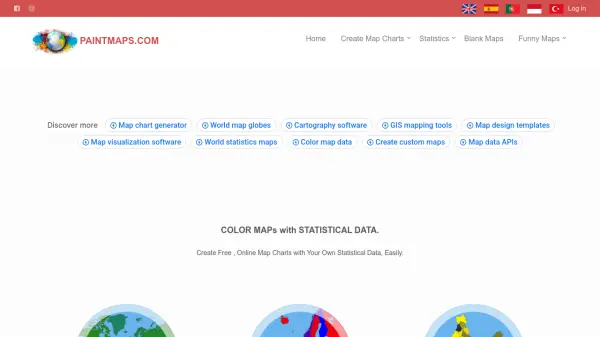
What is Paintmaps.com?
Paintmaps.com provides a free, online platform for generating interactive map charts with statistical data. Users can easily create customized maps for various geographical levels, including world maps, continent maps, country maps, city and region maps, and USA state maps. The tool allows for data visualization by coloring maps based on statistical inputs, making it suitable for reports, presentations, and academic works.
In addition to standard map charts, Paintmaps.com offers features such as blank maps for educational purposes, 3D stereogram maps for visual effects, and the ability to place photos on maps. The platform supports usage in business projects, personal blogs, social media, and data visualization tasks, providing an accessible solution for cartography and geography-related applications.
Features
- World Maps: Create interactive world map charts with statistical data
- Continent Maps: Generate continent-specific map charts for data visualization
- Country Maps: Customize country maps with user-provided statistical data
- City & Region Maps: Create detailed maps for cities and regions with data overlays
- USA State Maps: Generate USA and state-level map charts for statistical representation
- Statistics on Maps: Visualize statistical data directly on map charts
- Blank Maps: Access blank maps of countries for educational and cartography purposes
- 3D Stereogram Maps: Create 3D stereogram maps of countries for visual effects
- Place Photos on Maps: Overlay photos on maps for personalized visualizations
Use Cases
- Creating map charts for student homeworks and academic reports
- Visualizing election results or visited countries on maps
- Enhancing business projects and PowerPoint presentations with data maps
- Developing content for personal blogs, web pages, and social media accounts
- Supporting geography and cartography works with interactive maps
- Generating data visualization maps for research and analysis