Coral reefs bleach when prolonged heat stress breaks the symbiosis between coral animals and their photosynthetic algae. White skeletons replace vibrant color, fisheries decline, and coastal protection weakens. Managers need weeks of lead time to close dive sites, mobilize shade structures, or document baseline imagery for insurance claims. AI coral bleaching early warning systems fuse decades of satellite thermal climatology with modern machine learning to predict where reefs will stress next and how severe bleaching may become.
Marine scientists, reef restoration NGOs, and tourism operators all consume these forecasts through different lenses. Developers wiring AI chatbot assistants for conservation dashboards should treat NOAA and university models as authoritative backends, not replace them with generic LLM guesses. More environmental AI explainers appear on the EliteAI.tools blog index.
What AI Coral Bleaching Early Warning Means in Plain Language
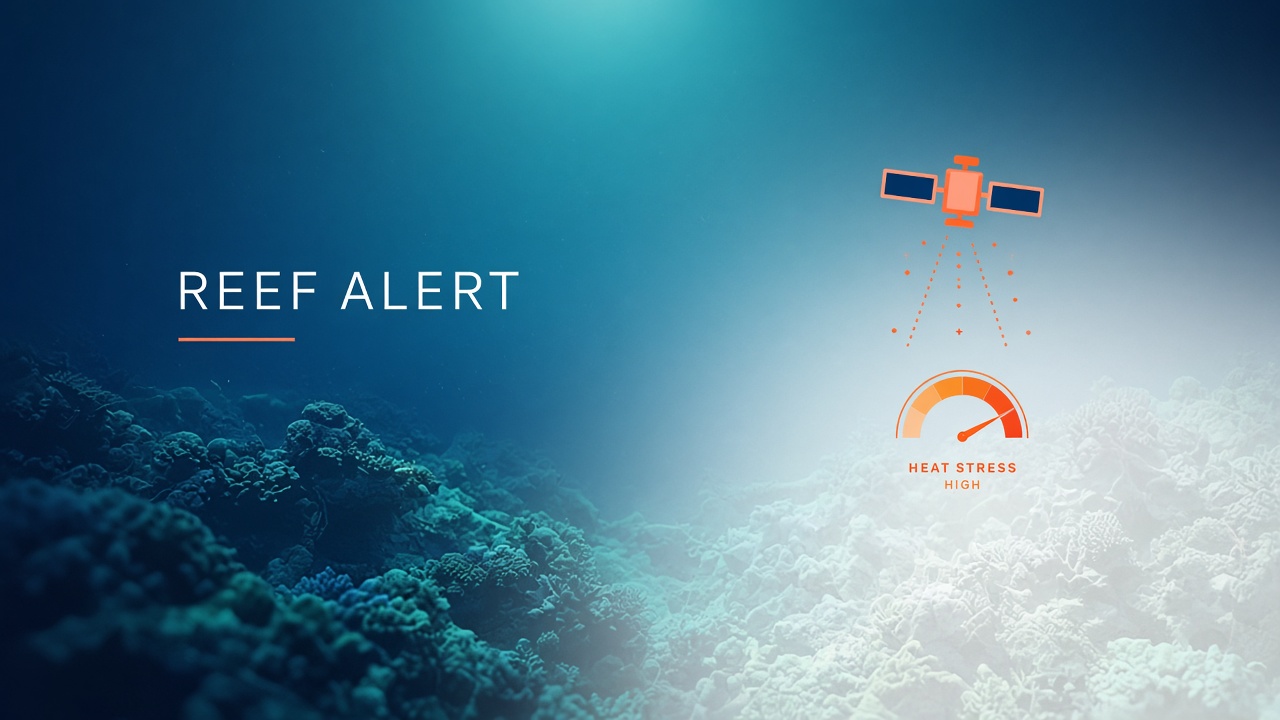
AI coral bleaching early warning is the use of machine learning and satellite-derived thermal stress metrics to forecast coral bleaching events days to weeks before widespread mortality appears in diver surveys. The physical driver is simple: corals live near their upper thermal limit. When sea surface temperature (SST) exceeds the local summer maximum and stays hot, degree heating weeks (DHW) accumulate. Past a threshold (often 4 DHW for significant bleaching), reefs pale. AI improves forecasts by learning nonlinear relationships between SST anomalies, wind, cloud cover, bathymetry, and historical bleaching reports.
Early warning differs from post-event mapping. After bleaching, change detection models quantify percent cover loss from Sentinel-2 or drone imagery. Forecast models aim to alert managers while intervention might still help (shade cloth on nursery corals, tourist redirection, scientific sampling before algae overgrow dead colonies).
| Metric | Definition | Operational use |
|---|---|---|
| HotSpot | SST minus local climatological maximum | Immediate stress indicator |
| DHW (Degree Heating Weeks) | Integrated HotSpot over 12 weeks | Bleaching severity forecast |
| Bleaching Alert Level | NOAA categorical risk scale | Public communication |
| ML reef forecast | Learned mapping from SST fields to local bleaching | Regional refinement (e.g., Florida reefs) |
How the Early Warning Pipeline Works
A coral bleaching early warning pipeline ingests daily satellite SST, computes HotSpot and DHW relative to a long baseline climatology, optionally assimilates in situ temperature loggers, trains ML models on historical bleaching surveys, and publishes gridded risk maps with alert levels. NOAA Coral Reef Watch (CRW) has operated global 5 km products since 1985, giving the field a four-decade thermal archive that modern AI models fine-tune rather than replace.
NOAA Coral Reef Watch baseline
CRW distributes satellite SST, nighttime-only SST for reduced diurnal bias, 5 km global Bleaching Alert Area products, and 50 km outlooks. HotSpot and DHW algorithms compare current SST to a monthly climatology derived from 1985-2012 (and updated baselines in newer versions). When DHW crosses 4, managers expect significant bleaching; above 8, widespread mortality risk rises. These thresholds emerged from empirical correlations with field observations across Pacific and Caribbean reefs.
XGBoost Florida six-week forecasts
Researchers at the University of Miami Rosenstiel School built gradient-boosted tree models (XGBoost) to forecast bleaching probability on Florida reefs up to six weeks ahead. Inputs include CRW thermal metrics, wind stress, and local bathymetry. Published results show improved skill over persistence baselines during marine heat waves, giving Florida Keys National Marine Sanctuary managers actionable lead time for communication and monitoring cruises.
Allen Coral Atlas and Sentinel-2 change detection
The Allen Coral Atlas maps global geomorphic reef zones and benthic cover using Planet Dove PlanetScope imagery at 3.7 m resolution, processed with machine learning classifiers trained on expert labels. While primarily a baseline habitat map, Atlas updates enable trend analysis when paired with bleaching years. Complementary Sentinel-2 missions (10 m multispectral) support change detection workflows: researchers report 88.9% accuracy distinguishing bleached from healthy reef pixels in some Caribbean test sites when combining spectral indices with CNN classifiers, though performance varies by depth and water clarity.
Reef manager workflow integration
Effective early warning reaches fishers, dive operators, and park rangers through channels they already monitor: email lists, VHF radio, and sanctuary web dashboards. Miami Rosenstiel forecasts feed Florida Keys communication templates that translate DHW numbers into plain-language alert colors. Managers pair thermal warnings with in-water validation teams using standardized bleaching observation protocols (BleachWatch, CoralWatch cards) so satellite predictions gain ground truth within 48 hours of alert escalation. AI change detection on Sentinel-2 then documents spatial extent for post-event reports to funding agencies and insurance adjusters assessing reef-dependent businesses.
Species and depth heterogeneity
Branching acroporids bleach faster than massive porites corals; shallow reef flats heat differently than mesophotic slopes. Regional ML models that include bathymetry and habitat class from Allen Coral Atlas reduce false alarms on deeper reefs that remain below lethal thermal stress even when surface SST spikes. Species-specific vulnerability databases (IUCN, Reef Resilience Network) help weight forecast messaging: nurseries growing heat-sensitive taxa receive priority shade deployment when six-week outlooks cross probability thresholds.
- Ingest daily SST from polar-orbiting and geostationary satellites.
- Compute HotSpot and DHW against climatological maximum monthly SST.
- Publish global alert levels (CRW Bleaching Alert Area).
- Train regional ML models on historical in situ bleaching surveys.
- Issue 1-6 week probabilistic forecasts for priority reef management units.
- After events, run Sentinel-2 or drone change detection to quantify cover loss.
Published Evidence and Operational Deployments
Operational systems already run at global scale through NOAA CRW, while regional ML forecasts and high-resolution change detection add precision where field validation exists. The 1985-present CRW archive underpins virtually every bleaching attribution study: without that baseline, "unprecedented" heat would lack context. Miami Rosenstiel XGBoost six-week Florida forecasts demonstrate that learned models beat naive persistence when ocean heat waves accelerate faster than climatology alone predicts.
Allen Coral Atlas Planet Dove monitoring gives NGOs a consistent global reef footprint for prioritizing interventions. Sentinel-2 change detection at 88.9% accuracy in published trials supports rapid damage assessment, though turbid water and sub-pixel mixing limit transfer to all reef types. Together, thermal forecasting plus post-event mapping close the loop from warning to documented impact.
Great Barrier Reef Marine Park Authority, Hawaiian Division of Aquatic Resources, and Caribbean regional networks subscribe to CRW feeds. Tourism operators display alert colors on booking pages. Research divers time photo-quadrat surveys to capture peak bleaching for long-term monitoring programs like Atlantic and Gulf Rapid Reef Assessment (AGRRA).
Global bleaching events in the 2020s
The 2023-2024 global marine heat wave pushed CRW alert levels to unprecedented spatial extent across the Atlantic, Pacific, and Indian Ocean basins simultaneously. Florida reefs experienced mortality levels not seen in centuries, validating the urgency of six-week ML forecasts that gave managers lead time to document baseline cover and adjust restoration nursery schedules. Each major event enlarges the labeled training set for gradient-boosted and neural forecast models, improving calibration for the next heat wave while reminding policymakers that thermal stress frequency now exceeds historical baselines used in DHW climatologies.
Limits, Risks, and Ethical Guardrails
Satellite SST measures the ocean surface, not the exact temperature on a reef flat at low tide where corals may experience extremes several degrees hotter than offshore pixels. AI forecasts inherit this blind spot unless augmented with in situ logger networks. Cloud cover gaps in optical change detection delay damage maps exactly when managers need them most.
- Spatial resolution: 5 km CRW pixels average over heterogeneous reef mosaics.
- Acclimation and adaptation: Corals in chronically warm lagoons tolerate heat better than models trained on global thresholds assume.
- Other stressors: Acidification, pollution, and crown-of-thorns outbreaks compound bleaching but rarely appear in thermal-only models.
- False alarms: Over-warning erodes trust among fishers and tourism operators.
- Data equity: High-resolution Planet imagery may not cover all nations equally.
Ethical guardrails include co-design with local reef stewards, transparent communication of uncertainty, avoiding blame directed at communities dependent on reef tourism, and linking early warnings to funded adaptation (restoration nurseries, MPAs) rather than surveillance alone. Indigenous sea country managers should control how alerts appear on their territories.
Who Should Use This and Who Should Wait
Reef managers, national marine sanctuaries, and regional ocean observing networks should integrate NOAA CRW feeds and regional ML forecasts today. Individual dive shops can display public alert maps without building custom models. Startups claiming proprietary bleaching AI should demonstrate additive skill over free CRW products before charging vulnerable island economies.
| Audience | Recommendation | Caveat |
|---|---|---|
| Marine protected area manager | Subscribe to CRW Bleaching Alert Area daily | Validate with local temperature loggers |
| Florida Keys researcher | Adopt Rosenstiel XGBoost 6-week outlooks | Retrain if baseline climatology updates |
| Global conservation NGO | Use Allen Coral Atlas for reef extent baselines | Pair with Sentinel-2 for event damage maps |
| Resort without science staff | Display public NOAA alerts; avoid custom black-box AI | Do not market "AI predictions" without validation |
Frequently Asked Questions
What degree heating weeks trigger bleaching warnings?
NOAA Coral Reef Watch uses 4 DHW as a significant bleaching threshold and 8 DHW for severe alert levels, based on decades of global field correlations since the 1985 product era. Local reefs may bleach earlier or tolerate higher values depending on history and species mix.
How far ahead can AI forecast Florida reef bleaching?
University of Miami Rosenstiel XGBoost models demonstrate skillful six-week bleaching probability forecasts for Florida reefs when ocean heat waves develop, outperforming simple persistence in published evaluations. Skill degrades beyond six weeks as weather uncertainty dominates.
How accurate is Sentinel-2 bleaching change detection?
Published Sentinel-2 workflows report up to 88.9% pixel-level accuracy separating bleached from healthy reef in clear-water trials, but accuracy drops in turbid or deep sites. Field validation with photo-quadrats remains essential.
What is the Allen Coral Atlas role in early warning?
Allen Coral Atlas provides global reef extent and benthic cover from Planet Dove imagery, supporting baseline prioritization rather than daily thermal alerts. Combine Atlas habitat maps with CRW thermal products for risk triage.
Do I still need in situ temperature loggers?
Yes. Satellite SST misses shallow reef flat extremes; loggers ground-truth alerts and improve regional ML models. Networks like Integrated Coral Observing Network (ICON) exemplify best practice.
Can early warning prevent bleaching?
Forecasts enable preparedness (monitoring, communication, localized shade for nurseries) but cannot stop marine heat waves driven by global climate change. Early warning is adaptation support, not a substitute for emissions reduction.
Conclusion
AI coral bleaching early warning builds on NOAA Coral Reef Watch 5 km HotSpot and DHW products anchored since 1985, extends them with Miami Rosenstiel XGBoost six-week Florida forecasts, and pairs global Allen Coral Atlas Planet Dove baselines with Sentinel-2 change detection reporting up to 88.9% accuracy in clear-water trials. The stack gives managers thermal alerts weeks ahead and damage maps shortly after. Limits include coarse pixels, subsurface stress blind spots, and equity in imagery access. Use free operational products first, add regional ML where validated, and always ground alerts in local logger data and community stewardship.