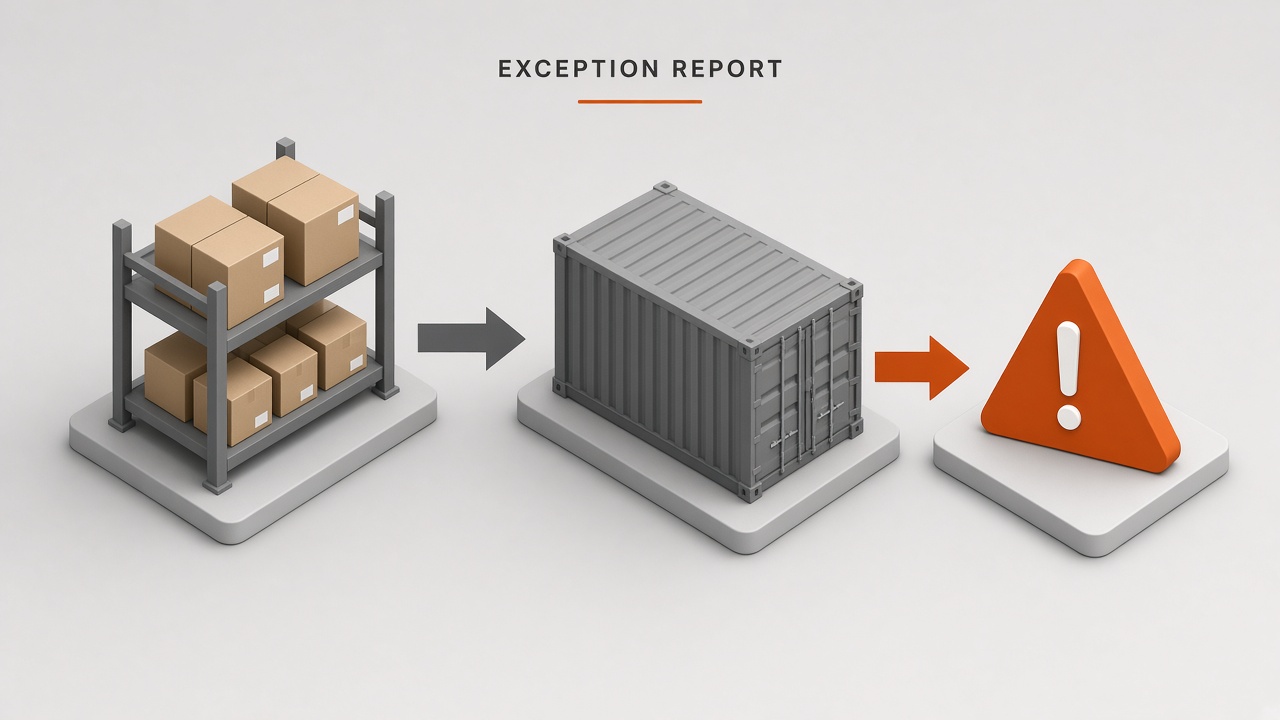
Supply chain analysts open each morning to spreadsheets of late shipments, stockouts, excess inventory, and supplier ASN mismatches exported from ERP and WMS systems. Leadership wants a concise exception report by the ops standup; manual pivot tables burn hours before anyone acts on root causes.
An ai workflow supply chain exceptions routine pulls daily exception data, clusters and prioritizes by revenue impact, drafts root-cause hypotheses for human validation, and assigns owners in the recurring ops meeting. AI summarizes patterns; planners and buyers confirm causes and countermeasures. Analysts often pair exception reporting with AI design tools for dashboard layout and AI writing assistants for narrative executive summaries once numbers are verified.
Exception Reporting Purpose in Supply Chain Ops
Exception reports exist to drive same-day or same-week corrective action, not to archive every ERP alert. AI helps analysts filter noise, group related failures, and explain likely drivers in plain language. Without owner assignment in ops meetings, reports become slide deck wallpaper.
Define exception types your organization tracks: line stoppage risk, customer OTIF misses, inbound delays, negative on-hand, phantom inventory, and forecast bias signals. Each type maps to a primary owner role: buyer, planner, warehouse supervisor, or transportation coordinator.
Daily Exception Data Pull
Automate a daily exception data pull from ERP, WMS, TMS, and supplier portals into a standardized table with timestamps, SKUs, locations, customers, and revenue at risk fields. Consistent schemas let AI cluster across days without relearning column names. Analysts validate extract completeness before analysis runs.
- Schedule overnight extracts after ERP cutoff with documented time zone.
- Include only open exceptions or those closed within the last 24 hours for trend context.
- Join master data: product hierarchy, ABC class, customer tier, supplier lead time.
- Flag rows with missing revenue or quantity fields for manual fix, not AI fill.
- Store raw extracts immutable; summaries are derived artifacts.
| Data source | Typical exceptions | Refresh cadence |
|---|---|---|
| ERP inventory | Stockouts, excess, negative on-hand | Daily |
| WMS outbound | Pick failures, short ships | Daily |
| TMS inbound | Late ASN, carrier delays | Daily plus intraday for critical lanes |
| Supplier portal | Confirmation mismatches | As synced |
Data Quality Gates Before AI Analysis
Run validation rules on extracts: duplicate keys, null customer IDs on allocated orders, and unit-of-measure mismatches. AI amplifies bad data into confident narratives. Analysts publish a daily data quality score alongside the exception report so ops trusts the headline numbers.
Cluster and Prioritize by Revenue Impact
AI clusters exceptions by shared attributes such as supplier, lane, SKU family, warehouse, and failure mode, then ranks clusters by revenue at risk and service level exposure. Human analysts adjust ranking when strategic customers or production lines override raw dollar sorting.
- Group inbound delays from the same supplier PO line into one cluster narrative.
- Separate chronic issues from first-time spikes using a rolling window tag.
- Surface top five clusters for ops meeting deep dive; list remainder in appendix.
- Cross-reference open corrective actions so repeat clusters escalate.
- Visualize cluster trend with simple charts; use design-oriented AI tools for layout, not for changing numbers.
Prioritization should align with contract OTIF penalties and internal line-down thresholds even when dollar values look small on low-unit-cost SKUs that block manufacturing.
Executive Summary Layer
After clusters are verified, AI drafts a one-paragraph executive summary stating top risks, affected customers, and expected resolution windows analysts confirm. Executives read this first in the standup; detail slides follow. Never include root-cause claims in the summary until hypotheses pass owner review.
Draft Root-Cause Hypotheses
AI proposes root-cause hypotheses from exception attributes and recent similar clusters, labeled clearly as hypotheses until owners investigate. Common patterns include supplier capacity, forecast step-change, master data errors, warehouse labor constraints, and transportation lane disruption. Owners accept, modify, or reject each hypothesis in the ops meeting.
| Hypothesis signal | Likely cause category | Owner role |
|---|---|---|
| Single supplier, many SKUs late | Supplier capacity or quality hold | Buyer |
| Forecast miss on one family | Demand spike or promo not in plan | Demand planner |
| Pick failures one shift | Labor or slotting issue | Warehouse supervisor |
| ASN vs receipt gap | EDI or portal sync error | Logistics coordinator |
Document rejected hypotheses too; they train the next prompt cycle and prevent repeated AI suggestions owners already disproved with field evidence.
Countermeasures and Due Dates
Each accepted hypothesis links to a countermeasure with owner, due date, and measurable exit criteria. AI can draft countermeasure language from playbooks; owners choose realistic dates. Track open actions in the same system ops reviews daily to close the loop.
Assign Owners in the Ops Meeting
The daily or weekly ops meeting assigns owners to top clusters, confirms hypotheses, and updates action status in front of the group. Analysts facilitate with AI-generated slides or writing AI narrative summaries, but buyers and planners speak to supplier calls and floor conditions.
- Review data quality score and extract timestamp first.
- Walk top clusters in revenue priority order with five-minute time boxes.
- Record owner, hypothesis status, and countermeasure due date in action log.
- Escalate unresolved chronic clusters to S&OP or executive supply review.
- Close actions only when exception metrics show sustained improvement.
Meeting notes should reference cluster IDs tied to extract dates so follow-up audits trace decisions. Avoid renegotiating numbers in the meeting without updating the source extract.
Handoff to S&OP and Forecast Processes
Patterns that repeat across weeks feed demand review and supplier risk discussions in S&OP, not only daily firefighting. Analysts package chronic cluster trends separately from acute daily spikes. Forecast owners adjust assumptions when hypothesis evidence shows sustained bias.
Tooling and Governance for AI Exception Reports
Store prompts, model versions, and analyst edit logs when exception narratives leave the internal network. Supplier names, customer allocations, and unreleased product codes may be sensitive. Prefer enterprise AI with data processing agreements over public tools for raw ERP exports.
Rotate analysts through prompt maintenance so one person's template does not become a single point of failure. Quarterly, compare AI cluster labels to manual classification on a sample week to catch drift.
Cross-Functional Playbooks for Repeat Clusters
When the same cluster type appears three weeks in a row, promote it from daily firefighting to a documented playbook owned by the functional lead. Playbooks list verification steps, standard countermeasures, and escalation thresholds so AI hypotheses start from institutional knowledge instead of rediscovering obvious causes. Analysts link playbook IDs in cluster narratives for faster ops meeting decisions.
Transportation, warehouse, and procurement leads co-author playbooks with analysts who supply historical cluster frequency charts from verified extracts. Playbooks are not static; update them when root causes change after major network redesigns or supplier changes.
Customer Communication Triggers
Define when an exception cluster triggers proactive customer communication versus internal-only action. AI drafts customer impact summaries from verified allocation data; customer service or account managers send approved messages. Never auto-email customers from AI output without human review of tone and commitment language.
Warehouse Floor Display of Top Clusters
Some sites post the top three daily clusters on floor boards with owner names and due dates after the ops meeting. Visual accountability complements the written report. Update boards when actions close so teams see progress, not stale priorities from prior weeks.
Shared Metric Definitions Across Sites
Define revenue at risk, OTIF, and cluster reopen rate the same way at every site before comparing AI reports in regional reviews. Analysts publish a one-page metric dictionary updated when ERP logic changes. Inconsistent definitions make AI summaries look divergent when data rules differ, not when operations perform differently.
Frequently Asked Questions
How do supplier portals fit the daily pull?
Supplier portal data often lags ERP and uses different confirmation statuses; map portal fields to internal codes before merging into the exception table. AI should not assume portal silence means on-time shipment. Buyers validate portal mismatches with supplier contacts before root-cause closure. Document sync frequency so ops knows which exceptions update intraday versus next morning.
Can AI adjust forecasts from exception patterns?
AI can flag forecast bias signals for planner review but should not write forecast numbers directly into ERP without human approval. Exception clusters show where actuals diverged from plan; planners investigate promo timing, new customer ramps, and structural demand shifts. Automated forecast changes without governance create double corrections when the original spike was one-time.
When is daily reporting not enough?
High-velocity or perishable supply chains may need intraday pulls for critical SKU lists while keeping the full daily report for comprehensive clustering. Define which customers or lines trigger intraday alerts separately from the AI narrative workflow to avoid alert fatigue.
How do we prevent optimizing the report instead of operations?
Measure closure of assigned actions and sustained metric improvement, not report generation speed alone. If clusters reopen repeatedly with the same owner, escalate process failure rather than accepting new AI hypotheses each week. Leadership reviews chronic reopen rates monthly.
Exceptions That Close, Not Pile Up
Supply chain analysts turn ERP noise into action when daily pulls are clean, AI clustering highlights revenue risk, hypotheses earn owner validation, and ops meetings assign accountable countermeasures. The report succeeds when exceptions drop, not when the summary reads smoothly.