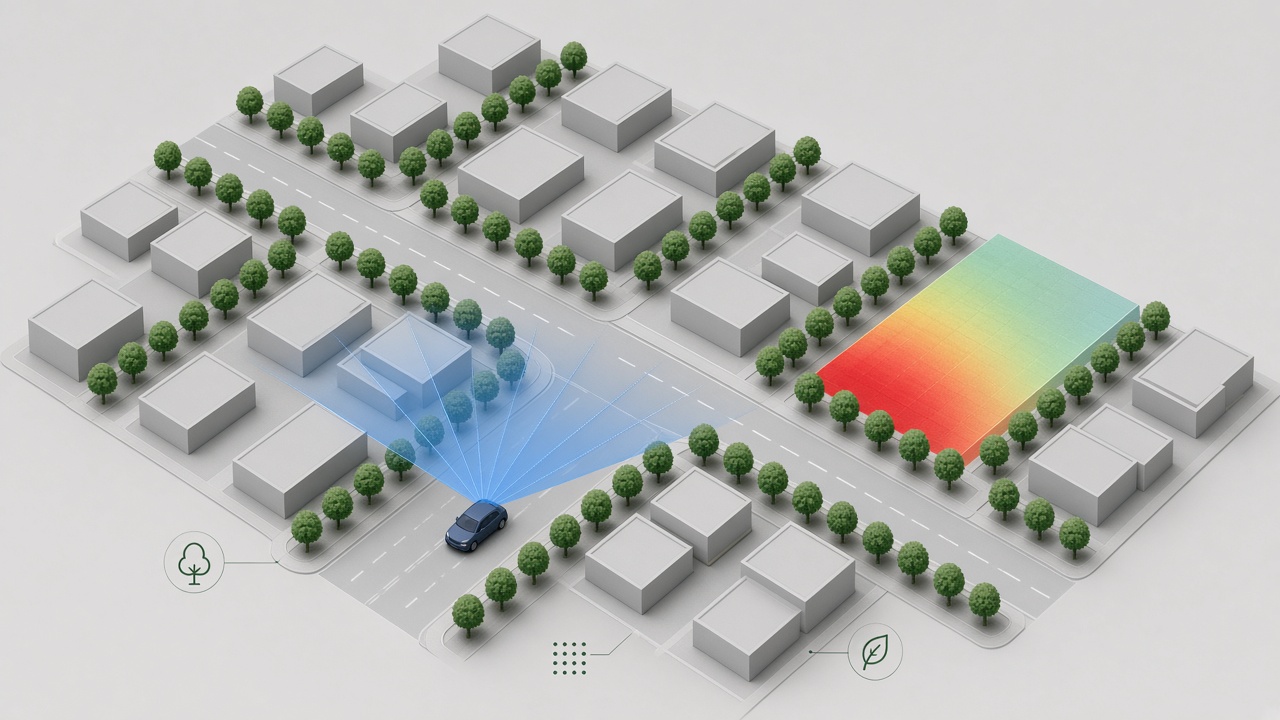
AI urban tree inventory combines car-mounted cameras, aerial and LiDAR point clouds, and semantic segmentation models to map street trees by location, species, canopy size, and health, feeding heat island mitigation, equity planting, and forestry work orders. Benchmark datasets like WHU-STree pair synchronized point clouds with high-resolution images across tens of thousands of annotated trees. USC researchers demonstrated low-cost canopy maps from free USDA National Agriculture Imagery Program photos when cities cannot afford full LiDAR surveys. Planners connect inventories to tools such as i-Tree Eco for ecosystem services valuation and optimizers like City-HEAT that weigh cool roofs against urban afforestation. Teams in AI research and municipal GIS shops evaluating popular AI tools should budget field validation, not only model accuracy slides.
Urban Forestry Data Gaps
Most cities lack a complete, current street tree register: legacy spreadsheets omit vacant planting sites, private yard trees confuse public ROW counts, and storm damage outpaces manual surveys. Field crews measuring diameter at breast height on foot are authoritative but slow. Without inventory, councils cannot target shade deserts, schedule pruning near power lines, or defend budget requests with defensible numbers. Heat emergencies make the gap visible when residents in treeless blocks face higher nighttime temperatures than leafy neighborhoods minutes away.
Automated surveys using mobile mapping systems capture LiDAR returns and panoramic imagery at traffic speed. Convolutional and transformer segmenters detect individual crowns, while post-processing splits merged canopies into tree instances. Accuracy still needs ground truthing on species labels, especially where invasives look similar to natives from nadir views alone.
Car and Aerial Imagery Pipelines
Pipeline stages ingest orthophotos, street-level video, or MLS point clouds, georeference features, run detection models, and export GIS layers compatible with ArcGIS or open QGIS workflows. NAIP aerial imagery refreshed every two to three years gives nationwide coverage at roughly 60 centimeter resolution, enough for canopy polygon mapping when paired with modern segmentation backbones. USC's approach shows cities without LiDAR budgets can still track canopy change over time, then layer LiDAR where available for height and three-dimensional structure.
WHU-STree spans two cities with 21,007 annotated instances across 50 species, supporting species classification, individual tree segmentation, and morphological parameter estimation benchmarks. Cross-city generalization remains hard: models trained on one climate zone mislabel drought-stressed crowns in another unless retrained with local labels.
| Data source | Delivers | Typical cost profile |
|---|---|---|
| NAIP orthophotos | Canopy polygons, change detection | Free federal program |
| Mobile LiDAR | DBH proxies, height, crown volume | Contract survey per mile |
| Street panoramas | Species hints, curb-side context | Vendor licensing or city fleet mounts |
| Field DBH tape | Ground truth, maintenance tags | Staff time intensive |
Species ID and DBH Estimation
Species classifiers ingest multispectral or RGB texture features; DBH estimation regresses trunk diameter from LiDAR stem returns or monocular depth approximations with calibrated error bars. i-Tree Eco uses species, DBH, and condition codes to estimate annual ecosystem services: stormwater interception, air quality removal, carbon storage, and energy savings from building shade. AI inventories accelerate parameter collection but should propagate uncertainty into service valuations rather than presenting false precision.
Pest and disease early warning layers flag crown dieback color shifts across seasons. Integration with extension entomology alerts helps prioritize emerald ash borer treatments before catastrophic loss hollows out block-scale shade.
Equity Targeting for Planting
Heat equity maps overlay surface temperature, income, asthma rates, and existing canopy to rank blocks where new street trees deliver the largest public health benefit per dollar. City-HEAT, demonstrated in Baltimore, optimizes multi-year portfolios of cool roofs, pavement treatments, cooling centers, and afforestation under climate uncertainty ensembles. Phoenix and Las Vegas planners using GatewayGS found default thermal satellite objectives sometimes favor reflective roofs over trees because satellites undercount pedestrian-level shade; sliders let policymakers weight tree co-benefits explicitly.
Planting without maintenance funding repeats historical inequities: young trees die on renters' blocks while wealthy districts receive irrigation trucks. Inventory systems should track planting dates, warranty periods, and watering contracts so equity scores reflect living canopy, not only planting promises.
Maintenance Work Order Integration
Modern urban forestry CRMs link each tree asset ID to pruning cycles, 311 citizen requests, and risk ratings for lean or decay. AI detection proposes additions and removals; arborists confirm in the field with tablet apps. Closed-loop updates keep heat models honest when storms remove mature oaks overnight. Delhi-NCR hackathon prototypes showed physics-informed neural networks and multi-objective optimizers can suggest cool roof versus greening mixes under municipal budgets, a pattern exportable to other megacities with Landsat land surface temperature feeds.
HOAs and utility easements complicate ownership: inventory metadata must record who maintains each tree to avoid pruning liability confusion. Integration with AI research groups at universities can supply internship labor for validation transects if data use agreements protect resident privacy.
i-Tree and Ecosystem Service Valuation
i-Tree Eco and related USDA Forest Service tools translate species, DBH, and condition fields into dollar estimates for air quality, carbon, stormwater, and building energy savings. AI inventories accelerate data entry but cannot replace condition codes assigned by certified arborists who spot internal decay, conks, and cabling needs. Present council budgets with ranges that reflect DBH measurement error from remote sensing rather than single-point precision that auditors will challenge.
Corporate sustainability teams partner with cities on right-of-way plantings to meet ESG reporting goals. Shared inventory APIs let employers sponsor blocks near transit hubs while forestry departments track survival rates. Transparent attribution prevents double counting the same tree in both municipal and corporate reports.
Connection to Urban Heat Island Interventions
Street trees lower radiant heat felt on sidewalks and building facades even when satellite land surface temperature barely moves, so inventory projects should pair with pedestrian thermal comfort sensors where budgets allow. Canopy gaps along transit stops and schoolyards are high-leverage planting targets because children and commuters cannot choose their exposure hours. Combining LiDAR height with building footprint models estimates shadow paths across summer afternoons, helping planners place species with broad crowns on the sunward side of vulnerable blocks.
LiDAR and 3D Canopy Structure
LiDAR point clouds capture crown height, vertical profile, and gaps between buildings and branches that nadir aerial photos alone cannot measure. USC researchers plan to fuse their NAIP-based canopy maps with public LiDAR where available, enabling block-scale shade path analysis for school playgrounds and bus stops. Mobile laser scanning from city fleet vehicles updates inventories faster than foot crews but still requires calibration against ground-measured DBH on a statistically valid sample.
WHU-STree's multi-modal benchmark shows species classification accuracy jumps when color imagery complements geometric LiDAR features, especially for deciduous versus evergreen separation. Single-modality models confuse stressed brown crowns with species that naturally bronze in autumn unless temporal stacks compare multiple seasons.
Cooling Benefits Beyond Satellite Temperature
Land surface temperature from satellites averages rooftop and pavement pixels with tree crowns, understating pedestrian comfort in tree-lined sidewalks where mean radiant temperature drops sharply. GatewayGS and similar optimizers document that reflective cool roofs often score cheaper per degree on satellite metrics than planting, while trees deliver shade, evaporative cooling, stormwater uptake, and mental health co-benefits invisible to thermal imagery alone. Policy sliders that weight pedestrian shade prevent optimization from deforesting plans that look efficient on paper but fry walkers in practice.
City-HEAT in Baltimore couples canopy interventions with cooling center access and cool pavement portfolios under climate projection ensembles, illustrating how tree inventory data feeds multi-objective planning rather than siloed forestry spreadsheets. Heat equity is not only where trees are missing today but where aging residents lack AC and walk to clinics along unshaded arterials.
Nighttime heat retention differs by surface material; inventories paired with land cover layers help explain why some tree-rich blocks still feel stifling after sunset when pavement stores energy. Combining canopy maps with cool pavement pilot locations avoids planting trees where root zones will heave newly installed reflective coatings.
Implementation Roadmap for Cities
Start with a pilot ward: run NAIP segmentation, sample 200 field plots, adjust models, then scale citywide with annual change detection.
- Secure GIS basemap and ROW tree policy definitions.
- Import existing spreadsheets and deduplicate asset IDs.
- Run automated canopy and street tree detection.
- Field-verify species on stratified random sample.
- Publish public canopy equity dashboard with maintenance SLA metrics.
- Feed prioritized planting list into capital budget and grant applications.
Community science partnerships can accelerate validation: trained volunteers adopt blocks, confirm species with smartphone apps, and flag removals the aerial model missed. Universities gain thesis datasets; cities gain trust in neighborhoods skeptical of top-down planning. Transparent error rates on the public dashboard beat claiming ninety-nine percent accuracy that crumbles the first time a journalist spot-checks random intersections.
Utility conflict layers prevent planting the wrong species under transmission lines where mature height violates easements. Inventory attributes should include clearance class, root zone conflicts with sewer mains, and sidewalk lift risk from large maples. AI detection proposes crown locations; arborists still decide species substitution lists per climate zone and allergenic pollen policies.
Federal Inflation Reduction Act and state green infrastructure grants increasingly ask for geospatial evidence of canopy inequity. Machine-readable inventories exported as GeoJSON accelerate application deadlines compared to PDF maps drawn once and forgotten. Funders want maintenance dollars attached; show five-year survival rates for prior planting cohorts, not only hole counts.
Frequently Asked Questions
How do HOAs affect public inventory scope?
HOA-managed landscaping trees are usually excluded from municipal street tree registries unless easements place maintenance on the city. Document ownership in attribute tables to prevent double counting canopy credit.
Can AI predict pest outbreaks from canopy color?
Seasonal color shifts flag stress worthy of inspection but cannot replace lab diagnostics or trap counts. Use alerts to route arborists, not to auto-schedule removals.
What grants fund AI tree inventory projects?
USDA Forest Service urban forestry grants, FEMA mitigation dollars, and state heat adaptation funds increasingly accept GIS inventories as planning evidence. Pair technical proposals with equity narratives and maintenance plans reviewers can audit.
How does i-Tree fit the workflow?
i-Tree Eco translates species and DBH lists into ecosystem service dollars and carbon metrics for council presentations. Export AI inventory tables into i-Tree compatible formats after field validation.
Will inventory reveal embarrassing maintenance backlogs?
Yes, and that transparency is the point: backlogs justify hiring arborists and contracting community stewards. Politicians prefer knowing deferred pruning liability before failure lawsuits, not after fallen limbs.
Should private yard trees appear in public inventory maps?
Public dashboards usually show street trees and public park assets; private canopy may appear only in aggregated canopy cover layers without parcel-level labels. Consult legal counsel before publishing addresses tied to tree health scores.
How often should AI inventories refresh?
Annual NAIP cycles support yearly canopy change maps; storm events trigger ad hoc reflight or mobile scans on damaged wards. Planting and removal workflows should update the database within 30 days of field completion.