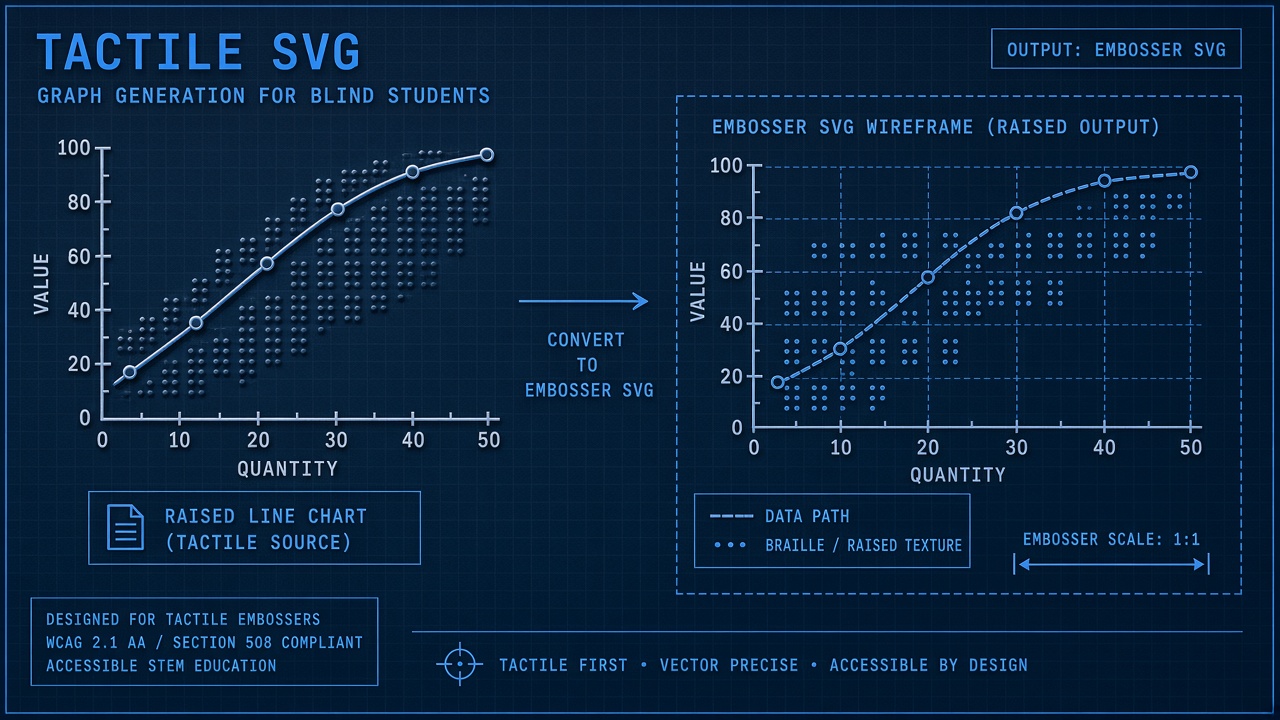
Blind and low-vision students in science, technology, engineering, and mathematics hit a wall when coursework relies on visual plots, circuit diagrams, and biology illustrations. Human tactile graphics specialists produce excellent embosser output but cannot scale to every problem set update. New pipelines use AI to convert digital charts into ai tactile graph blind students can read by touch, with semantic checks on axes and labels before printing. Tactile Vega-Lite, presented at CHI 2025, generates SVG paths tuned for embossers from Vega-Lite chart specifications. ChartFormer and the Chart2Tactile dataset (10,000 chart pairs) train vision-language models to map raster plots into tactile layouts. University disability offices coordinate Teachers of the Visually Impaired (TVIs) with ViewPlus and similar embossers. Readers exploring AI image generator research or popular AI tools for accessibility should understand how automated layout, verification, and human QA interact before replacing transcribers entirely.
Why STEM Figures Break Blind Access
STEM pedagogy assumes quick visual parsing of slopes, clusters, and labeled parts; without tactile or auditory equivalents, blind students receive incomplete problem statements. A calculus worksheet with three small plots may take a transcriber hours to braille and emboss while sighted peers finish in minutes. Publishers ship PDFs with untagged figures. LMS uploads multiply formats. When professors swap datasets weekly, manual transcription backlogs grow. AI automation targets the long tail of routine line graphs, bar charts, and scatter plots while reserving experts for novel 3D structures.
Nemeth Code and Unified English Braille affect how axis labels emboss. Tactile graphics need consistent texture for data series, clear axis breaks, and legends that do not overlap raised lines. Poor embosses teach wrong trends; verification is non-negotiable. Students report frustration when disability offices deliver figures days after assignments due, forcing extensions that still separate them from classroom pacing.
Automated Layout for Tactile Readability
Tactile Vega-Lite translates declarative chart specs into SVG with stroke widths, dot spacing, and label positions optimized for embosser resolution rather than pixel screens. Starting from structured input avoids guessing chart type from a screenshot. When only raster images exist, ChartFormer-class vision-language models predict chart elements and emit intermediate representations for tactile rendering. Chart2Tactile's 10k paired examples cover bar, line, pie, and scatter variants with ground-truth tactile layouts for supervised training. Output targets ViewPlus embossers and generic SVG-to-emboss workflows used in disability services labs.
| Pipeline stage | Input | Output |
|---|---|---|
| Spec-driven (Tactile Vega-Lite) | Vega-Lite JSON | Embosser-ready SVG |
| Vision-language (ChartFormer) | Chart image PNG | Structured graph + SVG |
| Human TVI edit | Draft SVG | Approved print file |
| Emboss | Final SVG or PRN | Tactile graphic on paper |
Semantic Verification of Axes and Labels
Automated checkers compare extracted axis ranges, units, and series labels against source data tables to catch swapped axes, missing legends, and hallucinated tick values before embossing. A line that rises visually but encodes a decreasing series in the CSV must fail validation. Semantic verification layers rule-based tests (monotonicity, label charset) with optional LLM critique that flags jargon unexplained in accompanying braille notes. TVIs review flagged files first; low-risk homework plots with matching data bindings may auto-approve when confidence scores exceed team thresholds.
Chemistry diagrams and free-body vectors need domain ontologies beyond generic chart parsers. Partnerships between computer science and disability services departments prototype validators per course: Physics 101 shares other rules than Organic Chemistry 201. Version control on SVG files lets students request reprints when errors surface during study sessions.
University Disability Office Workflows
Disability services intake forms collect course syllabi deadlines; automated pipelines pull LMS figure URLs, generate drafts overnight, and queue TVI review by priority date. Students register accommodation needs early; professors upload materials two weeks ahead when policies require it. Hybrid workflows assign routine charts to AI, route 3D molecular models to specialist vendors. ViewPlus Embosser printers in campus labs print on demand; mail services ship to remote learners. Cost per figure drops when batching SVG jobs, but labor shifts to verification rather than manual redrawing from scratch.
K-12 districts with fewer resources partner with regional cooperatives sharing embossers and TVI time. Open-source releases from CHI and arXiv papers let graduate students build course-specific plugins without commercial licenses. Document retention policies must protect student disability records when storing generated files on cloud drives.
Limits for Complex 3D Diagrams
AI tactile pipelines today handle 2D statistical charts well but struggle with perspective drawings, anatomy cross-sections, and interactive manipulatives that sighted students explore in simulation labs. Layered surfaces collapse confusingly on single-sheet embosses. Multipage raised-line overlays help but need human design. Calculus surfaces and vector fields may require sonication or haptic tablets as complements, not replacements. Set expectations with faculty: automation covers weekly problem set plots, not every museum-grade illustration in the textbook.
Publisher partnerships to ship structured chart data alongside PDFs would remove raster guessing entirely. Until then, disability offices should maintain vendor relationships for high-stakes exams and licensure prep where accuracy tolerance is zero.
National Federation of the Blind advocacy pushes publishers to include accessible figure metadata in K-12 adoptions. When state boards require accessible instructional materials, automated tactile pipelines could shrink the gap between sighted and blind test prep if verification keeps pace. Summer bridge programs for blind youth entering engineering majors benefit from tactile libraries of standard plots reused across calculus sequences, reducing repeated TVI labor each fall.
Haptic tablets and refreshable tactile displays complement paper embosses for dynamic functions students explore by tracing derivatives. AI that exports both static SVG and sonified audio descriptions gives multimodal study options. Competition math teams with blind participants report that overnight turnaround on practice tests levels the field when coaches upload PDFs early. Failure to caption figure-heavy slides during remote lectures remains a separate problem tactile graphs alone cannot solve.
Frequently Asked Questions
What does each tactile figure cost?
Manual transcription historically cost tens to hundreds of dollars per complex figure. AI-assisted workflows cut labor hours but retain TVI review fees, embosser supplies, and shipping. Campuses report largest savings on repeated introductory courses with similar plot types each semester.
How is braille math handled on graphs?
Axis labels may use Nemeth Code in braille alongside raised lines. Automated tools must export label text for braille translation engines; verify decimal points and negative signs emboss correctly. Some teams attach QR codes linking to accessible data tables for verification.
Should publishers automate tactile output?
Ideal future state ships accessible figure packages with every textbook adoption. Today most disability offices remediate after purchase. Advocate for Vega-Lite or data tables in instructor editions during procurement RFPs.
Can AI replace TVIs?
No. TVIs train students on tactile discrimination, orient figures, and catch semantic errors models miss. AI scales draft production; TVIs guarantee pedagogical equivalence and mentor students on when to request human redesign.
What about calculus and chemistry diagrams?
Calculus plots with multiple series benefit from spec-driven tools when professors provide data files. Chemistry bond diagrams often need specialist raised-line kits; vision-only AI confuses stereochemistry. Route by course code in the intake system.
What turnaround time is realistic?
Same-day service is feasible for simple auto-approved charts when data is clean. Novel figures need two to five business days for TVI review. Syllabus-aligned deadlines beat emergency all-nighters that invite mistakes.
Chart2Tactile and Tactile Vega-Lite represent a shift from handcrafted one-offs to reproducible pipelines blind students can trust when labels match source assignments. Investing in semantic verification prevents the embarrassment of embossed trends that contradict classroom lectures. As models improve, disability offices should publish open statistics on error rates and student satisfaction to guide procurement.
Students learning sonification tools alongside tactile graphs develop multimodal literacy suited to data science careers. AI generation lowers the barrier to practicing that combination on weekly homework instead of only before exams. Faculty training slides should show examples of acceptable embossed output so professors design assignments with tactile-friendly data exports from the start.
International campuses must align embosser paper sizes and braille codes with local standards. ChartFormer outputs may need regional tweaks to label languages and decimal separators. Building those locale rules into verification scripts early avoids reprinting entire exam batches.
NSF and NIH training grants increasingly ask how institutions broaden participation of students with disabilities in STEM. Documented tactile automation metrics strengthen those proposals when paired with student outcome data. Alumni networks of blind engineers mentor undergraduates on requesting timely figures, reducing dropout attributed to inaccessible materials rather than academic ability.
Open textbook initiatives should ship Vega-Lite or CSV companions for every figure in introductory statistics courses. Faculty who adopt OER without accessible data force disability offices into expensive remediation. Procurement checklists that score publishers on structured figure delivery reward vendors investing in inclusive design upstream.
Graduate teaching assistants uploading weekly R or Python plots to course sites can export figures as structured JSON when professors adopt spec-driven tools, bypassing raster-only screenshots that break automation. Short faculty workshops on accessible figure publishing reduce disability office load more than any single model upgrade alone.
Blind students participating in data science hackathons need same-day tactile copies of sponsor datasets when plots update hourly. Cloud emboss queues with priority flags for competition deadlines prevent teams from withdrawing when accessibility falls behind agile development sprints on the main floor.
Professional societies in mathematics and physics should publish tactile figure guidelines alongside author style sheets. When journals require data availability statements, include machine-readable chart specs so blind reviewers can evaluate submissions without requesting special formats after acceptance.
Summer STEM camps for blind youth can preload tactile figure packs before students arrive, building confidence on day one labs instead of waiting for emboss jobs during orientation week when disability staff are busiest with intake.