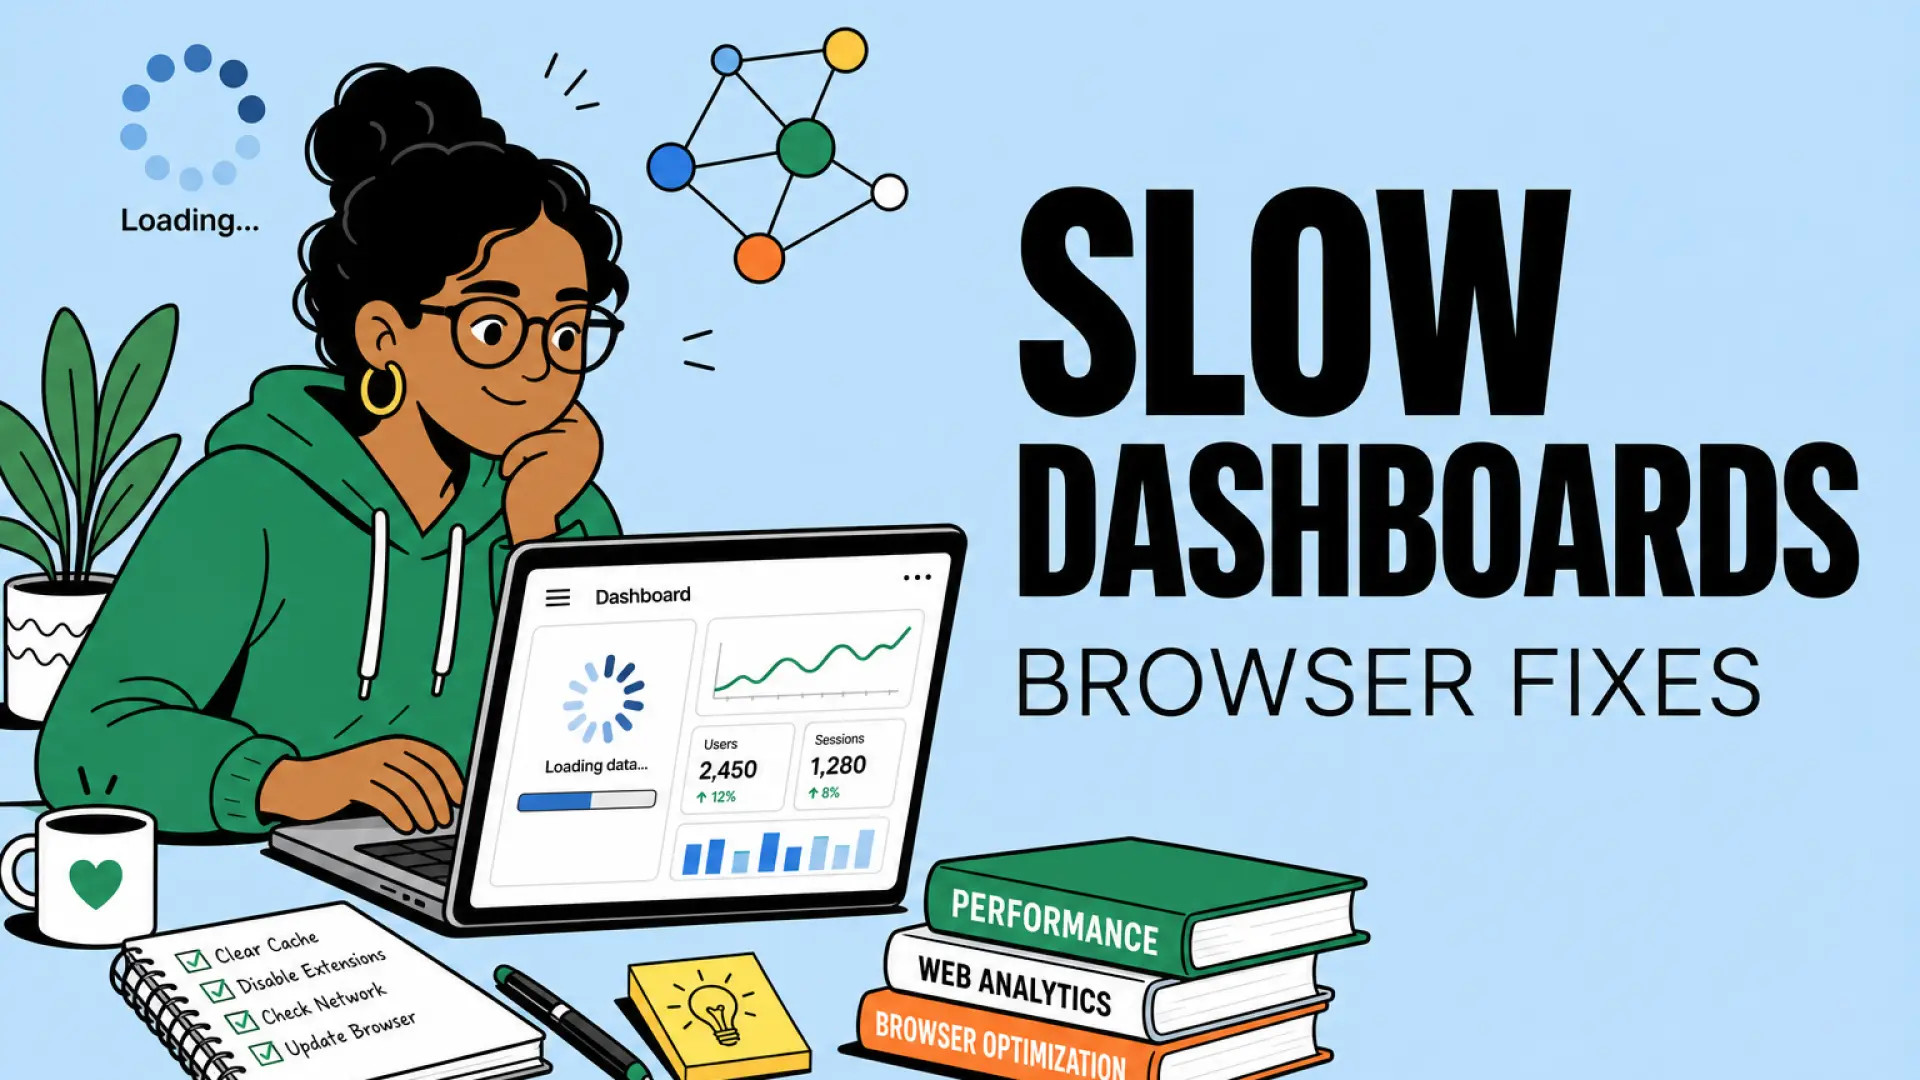
The usage page spins for thirty seconds while token charts stay blank. A slow ai vendor dashboard rarely means the vendor is down; it usually means your browser, network, or query scope is asking the UI to render more than it can comfortably load. Client-side triage fixes most cases before you open a support ticket.
This guide covers isolation steps, date range tuning, extension conflicts, and when to skip the UI for API exports. Teams using AI writing and AI marketing tools often share admin consoles with heavy analytics; the same fixes apply across vendors.
Isolate: Incognito, Network, and VPN
Open the dashboard in a private window on a clean network before blaming the vendor. Isolation separates browser state from routing problems. If the page loads fast in incognito on mobile LTE but crawls on corporate Wi-Fi with extensions enabled, you have a local cause, not a platform outage.
- Test incognito or a fresh browser profile with no extensions.
- Compare office network, home network, and mobile hotspot.
- Disable VPN, split tunnel, or proxy temporarily and retest.
- Check vendor status page and community forums for regional incidents.
- Record time-to-first-byte with browser devtools Network tab.
| Test condition | Fast load | Likely cause |
|---|---|---|
| Incognito only | Yes | Extension, cache, or SSO cookie conflict |
| Mobile hotspot only | Yes | Corporate DNS, firewall, or TLS inspection |
| Slow everywhere | No | Vendor incident or oversized query scope |
| VPN off fixes it | Yes | VPN egress path or geo routing |
SSO redirects can loop when clock skew or stale session cookies fight the identity provider. Clear site data for the vendor domain once after confirming incognito works. Document which network path your finance team uses; they often hit dashboards during month-end close when everyone queries the same date range.
Reduce Default Date Ranges
Narrow the date picker before the page requests twelve months of granular usage. Admin consoles aggregate millions of log lines when you select "all time" or a full fiscal year on first load. Default to seven or thirty days, then expand only when export or drill-down requires it.
Many platforms persist the last selected range in local storage. One analyst who opened a year-wide view slows every subsequent visit for that browser profile. Reset filters to vendor defaults after large exports. For teams tracking marketing campaign spend across models, pre-aggregate in your data warehouse and link out to the vendor UI for spot checks instead of living inside the heaviest chart view daily.
- Start with seven-day window for operational monitoring.
- Use thirty-day window for billing reconciliation.
- Reserve ninety-day or custom ranges for quarterly reviews.
- Filter by project, API key, or workspace before opening detail tabs.
- Avoid loading user-level drill-down until top-level charts finish.
Browser Extension Conflicts
Ad blockers, privacy extensions, and password managers inject scripts that break analytics SPAs. Dashboard UIs built as single-page applications fetch dozens of JSON endpoints on load. Extensions that block tracking pixels sometimes block legitimate API calls whose paths resemble ad network URLs.
Disable extensions one at a time or use a managed browser profile for admin work. Common culprits: uBlock Origin on subdomain patterns, HTTPS Everywhere rewriting CDN assets, and corporate DLP plugins scanning WebSocket traffic. DevTools Console shows blocked requests as red entries or CORS errors that look like server faults.
Managed admin browser profile
Create a dedicated Chromium profile with only SSO and vendor bookmarks. No shopping extensions, no tab suspenders that unload background tabs mid-query. IT can deploy this profile via policy for teams that live in writing tool admin panels daily. Document the profile name in internal wiki so new hires do not debug slowness on their personal browser for a week.
When to Use API Exports Instead
Pull usage and billing data through the vendor API when the UI cannot render your scope in reasonable time. Exports run server-side with pagination and async jobs. Dashboards optimize for human scanning; APIs optimize for bulk retrieval into spreadsheets, BI tools, or internal chargeback systems.
- Identify the report you need: tokens, costs, users, model breakdown.
- Check API docs for equivalent endpoints and rate limits.
- Run a scripted export with date chunks (weekly or monthly).
- Store results in your warehouse; build lightweight internal charts.
- Reserve the vendor UI for alerts, key rotation, and policy changes.
Scheduled exports beat manual dashboard refreshes during audit season. Log export job IDs and row counts for reconciliation. If the API is also slow, the bottleneck is backend aggregation, and support needs your org ID, date range, and approximate row volume, not a screen recording of a spinning loader.
Performance Monitoring Habits
Track median dashboard load time weekly from a standard machine and network. Spike detection catches vendor regressions early. Pair with synthetic checks that hit a lightweight settings page versus the heavy usage page. Teach teams that leaving ten admin tabs open on different date ranges multiplies memory use and triggers browser tab discarding that feels like random slowness.
The Bottom Line
A slow ai vendor dashboard usually yields to isolation testing, narrower date ranges, extension-free admin profiles, and API exports for heavy reporting. Confirm network and SSO before assuming outage. Document a standard admin browser setup so writing and marketing leads spend time on decisions, not waiting for charts.
Frequently Asked Questions
Why does SSO make the dashboard reload repeatedly?
Clock skew, expired refresh tokens, or IdP session timeout can cause redirect loops. Sync system time, clear cookies for the vendor domain, and verify SAML or OIDC callback URLs match the vendor docs. Test in incognito to rule out extension interference with the login iframe.
Can ad blockers slow AI admin consoles?
Yes. Block lists sometimes match analytics or CDN paths the dashboard needs. Whitelist the vendor domain or use a clean admin profile. Check the browser console for blocked fetch requests before opening a performance ticket with the vendor.
Is mobile dashboard slowness the same issue?
Mobile browsers run fewer extensions but have less memory. Wide date ranges hurt more on phones. Use mobile for alerts and approvals; run large reports from desktop API exports or a narrowed date window.
How do I tell vendor outage from local slowness?
Check status page, test from mobile hotspot and incognito, and ask a colleague on a different network. If all paths are slow for all users, escalate with timestamp and org ID. If only your browser is slow, fix extensions, cache, or date range first.