What is amCharts?
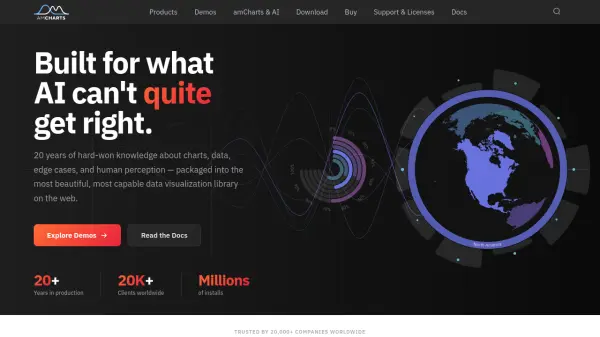
amCharts is a comprehensive data visualization platform that provides over 60 chart types, interactive maps, professional stock charts, and Gantt charts. Built on HTML5 Canvas for high performance, amCharts delivers smooth animations, responsive layouts, and built-in accessibility features. It supports composable layouts, allowing multiple charts to be combined in a single container with scrollbars, buttons, and color pickers.
amCharts offers AI-friendly tools including MCP servers and skill files that enable AI assistants to generate correct amCharts code. With a 20-year track record and trusted by thousands of companies worldwide, amCharts provides a free tier with a backlink and paid plans for removing branding and accessing source code.
Features
- 60+ Chart Types: Includes bar, line, pie, Sankey, treemap, radar, maps, stock, Gantt, spiral, Voronoi, and more.
- Interactive Maps: Geo maps with bundled GeoJSON datasets, heat rules, and point clustering.
- Stock Chart: Professional financial charting with 34 built-in indicators, 22 drawing tools, and multi-panel layouts.
- Gantt Chart: Drag-and-drop project timelines with dependency links, resource allocation, and event API.
- Composable Layouts: Combine multiple charts in one container with scrollbars, buttons, and resize handles.
- Canvas-Powered Performance: Built on HTML5 Canvas for fast rendering and smooth interactions.
- Built-in Accessibility: Screen reader support, keyboard navigation, focusable elements, and ARIA attributes.
- AI-Friendly: MCP servers and skill files for AI code generation with correct amCharts syntax.
- Animation Framework: Animates any element or property, including data transitions.
- Free Commercial Use: Full functionality with a small backlink; no time or user limits.
Use Cases
- Building interactive dashboards for business intelligence.
- Creating financial charting applications with technical indicators.
- Visualizing geographic data with interactive maps.
- Developing project management tools with Gantt charts.
- Adding data visualizations to web and mobile applications.
- Generating charts for reports and presentations.
FAQs
-
Is amCharts free to use?
Yes, amCharts offers a free tier that provides full functionality with a small backlink. It is free for commercial and non-commercial projects with no time or user limits. -
What chart types does amCharts support?
amCharts supports over 60 chart types, including line, area, bar, column, pie, donut, scatter, bubble, candlestick, stock, map, Sankey, chord, treemap, sunburst, radar, gauge, Gantt, waterfall, funnel, heat map, spiral, Voronoi, violin, word cloud, and Venn diagrams. -
Does amCharts work with AI tools?
Yes, amCharts provides MCP servers and skill files that allow AI tools like Claude, ChatGPT, Gemini, and Copilot to generate correct amCharts code from natural language descriptions. -
What is the difference between the Free and Annual subscription?
The Free tier includes all functionality with an amCharts backlink and no time or user limits. The Annual subscription removes the backlink, provides free version upgrades, and includes priority support, starting from $80 per developer seat per year. -
Does amCharts support accessibility?
Yes, amCharts has built-in accessibility features including screen reader support, keyboard navigation, focusable elements, and ARIA attributes, making it suitable for enterprise accessibility audits.