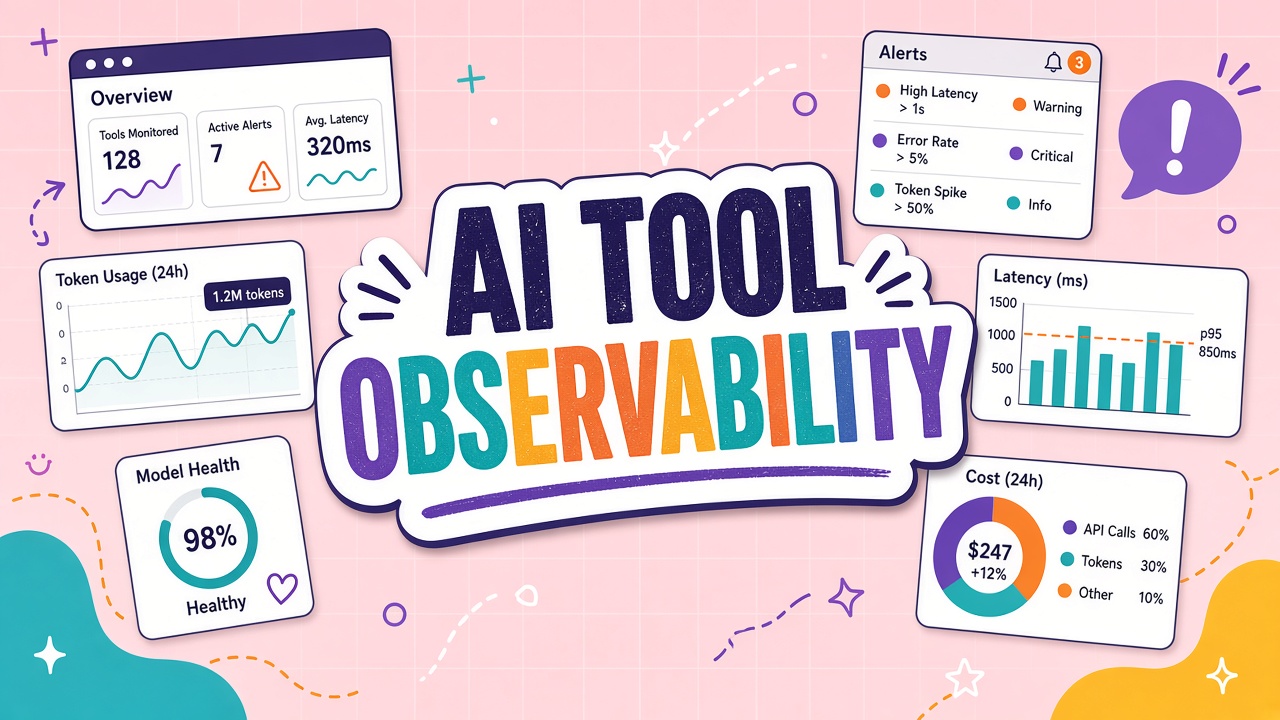
A marketing team launches an AI email generator. Week one looks great. Week six brings complaints: tone drift, higher bounce rates, and a finance surprise when the API bill doubles. Traditional uptime monitoring showed green because servers responded 200 OK. What failed was invisible: prompt changes, retrieval noise, and silent model updates. AI tool observability closes that gap with request tracing, token and cost dashboards, quality drift alerts, and log policies that balance debugging power against PII and compliance risk.
Observability is not optional for production LLM features. Teams running AI automation workflows and integrating multiple AI API providers need the same rigor applied to microservices: structured logs, distributed traces, metrics, and eval hooks tied to business outcomes, not only infrastructure health.
What AI Tool Observability Covers Beyond Uptime
Classic monitoring asks whether services are up. AI observability asks whether outputs are correct, safe, on-brand, and affordable at scale. That requires capturing model name, prompt version, retrieval sources, tool calls, latency per stage, token counts, estimated cost, user feedback, and downstream business events (ticket resolved, code merged, campaign sent).
Without those signals, debugging a bad answer means reproducing luck in a chat playground. With them, engineers replay exact traces, compare against last week's baseline, and tie regressions to a deploy, embedding reindex, or vendor model swap announced in fine print.
Logs, metrics, and traces for LLM apps
- Logs: Discrete events (errors, refusals, filter triggers) with correlation IDs.
- Metrics: Aggregates (p95 latency, tokens per request, cost per feature, thumbs-down rate).
- Traces: End-to-end spans from HTTP request through retrieval, inference, tool execution, and response assembly.
Request Tracing Across Retrieval, Inference, and Tools
A single user message may traverse authentication, rate limiting, embedding search, reranking, primary LLM call, two tool executions, and a final summarization pass. Distributed tracing assigns each step a span with timing and metadata. OpenTelemetry-compatible instrumentation is increasingly supported by orchestration frameworks and vendor SDKs.
Effective traces include stable identifiers: trace_id, session_id, user_id (hashed where
required), prompt_template_version, and model_snapshot if the provider exposes dated model IDs. Support
teams search by trace ID to answer "what happened on this message?" without engineering escalation for every ticket.
| Span | What to record | Why it matters |
|---|---|---|
| Retrieval | Query, top-k IDs, scores, index version | Explains wrong or stale citations |
| LLM inference | Model, tokens in/out, finish reason, latency | Cost and quality debugging |
| Tool call | Tool name, args (redacted), status, duration | Security and integration failures |
| Post-processing | Moderation result, format validation | Blocked or truncated outputs |
| Feedback | Rating, category, optional comment | Ground truth for drift detection |
Automation platforms chaining dozens of steps benefit especially from trace visualization because failures may occur five hops after the visible error message.
Token and Cost Dashboards
Token usage is the metered heartbeat of LLM economics. Dashboards should break spend down by environment, customer tier, feature flag, model, and team. Daily anomalies (3x Tuesday vs Monday) trigger investigation before invoices arrive. Include input vs output token split because pricing ratios differ by provider and model generation.
Cost allocation helps product managers decide which features deserve frontier models vs distilled routes. Show cost per successful task, not only per request: a cheap failed retry loop can exceed one successful premium call. Integrate with finance systems using stable SKU labels ("support_bot_tier2_gpt4o") rather than raw model strings that change quarterly.
Metrics finance and engineering both read
- Total daily spend vs budget cap with forecast line.
- Tokens per active user and per resolved ticket or generated asset.
- Cache hit rate for embeddings and repeated FAQ queries.
- Fallback rate to secondary models (quality and cost impact).
- Tool call count per session (runaway agent detection).
Quality Drift Alerts and Eval Hooks
Models change behavior without semver bumps users notice. Providers fine-tune behind aliases, update safety filters, or shift reasoning defaults. Quality drift is gradual divergence from expected answers on canonical eval prompts. Observability pipelines schedule nightly eval jobs, compare scores to rolling baselines, and page owners when classification accuracy, JSON validity rate, or human preference proxies drop beyond thresholds.
Pair automated evals with online signals: thumbs-down rate, escalation to human agents, edit distance before users publish AI drafts, and downstream KPIs (support reopen rate, ad CTR). Alert rules should reduce false positives by requiring correlated signals across two windows, not a single bad hour during an unrelated outage.
Store eval datasets in version control with change review. When marketing updates brand voice guidelines, update eval rubrics the same week or drift alerts will either fire constantly or miss real regressions.
PII in Logs: Redaction, Minimization, and Access Control
Full prompt logging aids debugging but creates compliance debt. Names, emails, government IDs, payment details, and health information routinely appear in user messages and retrieved chunks. Observability programs define field-level redaction before write, tokenization for reversible lookup by privileged roles, and strict retention TTLs shorter than generic application logs where regulations require.
Never log complete API keys, OAuth refresh tokens, or raw tool responses from HR systems. Use structured scrubbers and test them on synthetic PII corpora. Restrict log viewer access via SSO groups and audit every export. For EU GDPR and similar frameworks, document lawful basis for inference logging and honor deletion requests across trace backends, not only primary databases.
// Example redaction hook before log write
function sanitizeForLog(payload) {
  return redactFields(payload, [
    'email', 'phone', 'ssn', 'credit_card',
    'authorization', 'cookie', 'api_key',
  ]);
}
Vendor Dashboards vs Custom Telemetry
OpenAI, Anthropic, Google, and specialist gateways offer usage dashboards and limited tracing. They rarely connect to your business metrics or cross-provider unified views. Most mature teams export telemetry to Datadog, Grafana, Honeycomb, Langfuse, Phoenix, or similar platforms while treating vendor consoles as billing reconciliation, not sole source of truth.
Unified telemetry becomes critical when a workflow fans out across embedding hosts, rerankers, primary LLMs, and self-hosted guardrail models. Without a single trace ID stitched across vendors, engineers blame the wrong dependency during incidents. Standardize on OpenTelemetry context propagation in your orchestration layer even if individual SDKs require thin wrappers. Document which spans each vendor natively supports so gaps are visible in architecture diagrams rather than discovered during outages.
Sampling strategies keep costs manageable at high volume. Always sample errors, safety blocks, and sessions with negative user feedback at 100 percent while probabilistically sampling happy-path traffic. Stratified sampling by customer tier prevents enterprise accounts from being underrepresented in quality metrics. Revisit sampling rates after traffic doubles because rare regressions hide easily in aggressive downsampling.
When evaluating AI API products and orchestration layers, confirm export APIs, webhook support for usage events, and whether traces include tool spans or only completion objects. White-label chatbots without export hooks leave enterprises blind during incidents.
Frequently Asked Questions
How long should AI logs be retained?
Align with product policy and regulation, often 7 to 30 days for full prompts in production, longer for aggregated metrics without PII. Legal hold processes must pause deletion for involved traces without copying sensitive content to unsecured tickets.
What do auditors ask about LLM observability?
Auditors request evidence of access controls on logs, retention configuration, incident response runbooks referencing trace IDs, and proof that PII minimization is implemented technically, not only in policy PDFs. SOC 2 and ISO programs increasingly include AI feature scopes explicitly.
Do logs train vendor models?
Depends on provider tier and settings. Enterprise agreements often opt out of training on customer data. Observability design should note contractual flags and avoid sending production PII to third-party eval SaaS without DPAs.
What is the minimum viable observability for a small team?
Structured JSON logs with correlation IDs, daily token spend alerts, a 50-prompt eval set run weekly, and user thumbs on every output. Add distributed tracing when tool chains exceed three steps or multiple services participate per request.
How is drift different from ordinary bugs?
Bugs reproduce from deterministic code paths. Drift appears without deploys when model behavior, retrieval corpora, or external APIs shift. Observability separates version-controlled changes from external variance by tagging all dependencies in traces.
Make AI Behavior Visible and Accountable
AI tool observability turns opaque chat endpoints into measurable systems. Request tracing explains individual failures, token dashboards control economics, drift alerts catch silent regressions, and PII-aware logging keeps debugging compatible with compliance. Teams scaling automation products should treat telemetry as part of the feature definition, not infrastructure afterthought.
Before adopting new API integrations , verify export paths, retention controls, and eval integration. Users experience quality through answers, not server pings. Observability ensures your team sees what they see before trust erodes.