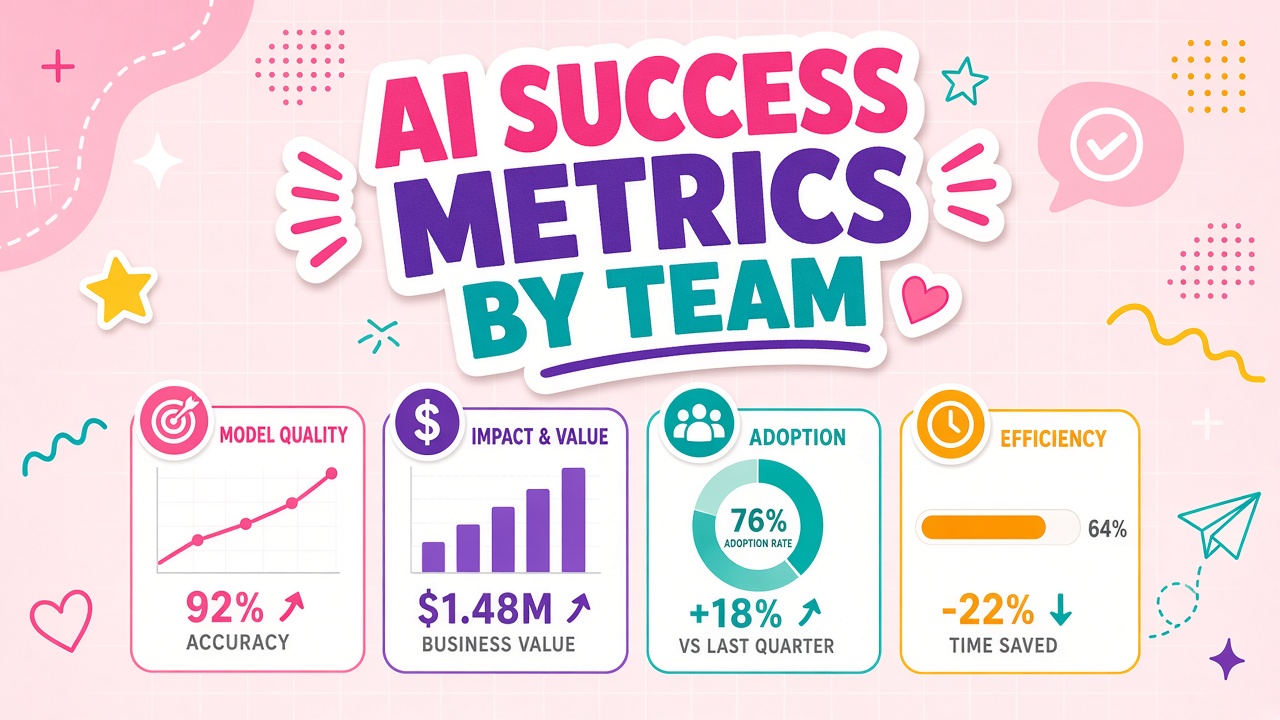
Leadership loves a single dashboard number. "We saved four hundred hours" looks great in a quarterly review until support escalations rise, marketing publishes off-brand copy, or engineering ships suggestions that fail review. Generic time-saved metrics hide tradeoffs and encourage gaming.
Defining AI tool success metrics by team means choosing two to four measurable outcomes per function, tied to named workflows, with baselines captured before rollout. This guide covers support, marketing, and engineering metric tables, anti-metrics to drop, and FAQ on baselines and seasonality. Shortlist tools in AI marketing tools and AI writing tools only after your team-specific scorecard exists.
Why Generic "Time Saved" Fails
Time saved without quality context rewards fast bad output. A draft generated in thirty seconds that needs forty minutes of correction is net-negative. Generic totals also mix incompatible jobs: a support macro is not a marketing brief. Aggregates look positive while each function suffers locally.
Replace one org-wide "hours saved" KPI with workflow-level metrics owned by the team that performs the job. Finance can roll up totals for budget conversations, but adoption decisions happen at the workflow layer with explicit quality gates.
Anti-metrics to drop
- Raw prompt count: Activity without shipped outcomes.
- Login days: Performative opens without completed jobs.
- Seats provisioned: Procurement success, not adoption success.
- Executive demo tasks: Scenarios that never match production inputs.
| Vanity metric | Why it misleads | Replace with |
|---|---|---|
| Prompts per user | Rewards spam and low-stakes play | Accepted outputs per week |
| Time saved (self-reported) | Optimism bias, no rework subtracted | Median total work time vs baseline |
| Tool NPS only | Happy users on wrong workflow | First-pass acceptance rate |
Support Team Success Metrics
Support success is measured in resolved conversations, customer sentiment, and safe escalation paths. AI assists drafting, summarizing threads, or suggesting knowledge base links. Metrics must catch when drafts increase rework or hide product risk.
| Metric | Definition | Adopt signal | Reject signal |
|---|---|---|---|
| Median handle time | Creation through send on AI-assisted tier-one replies | Stable drop vs baseline with same CSAT | Faster draft, longer total thread time |
| CSAT on assisted threads | Survey score where AI step used | Within one point of non-assisted baseline | Statistically lower over four weeks |
| Escalation rate | Tier-one to tier-two after AI draft | Flat or down vs baseline | Rising misroutes or wrong fixes |
| First-pass acceptance | Draft sent with minor edits only | Majority minor on representative tickets | Most drafts rewritten from scratch |
Marketing Team Success Metrics
Marketing cares about cycle time, error rate, and brand compliance more than raw word count. AI assists briefs, outlines, variant copy, and localization drafts. A tool that speeds drafts but increases legal review is not a win.
| Metric | Definition | Adopt signal | Reject signal |
|---|---|---|---|
| Brief-to-publish cycle | Days from approved brief to live asset | Median drop without quality tradeoff | More revision rounds than baseline |
| Brand rubric score | Editor checklist on final published piece | Scores match or beat pre-AI baseline | Tone or claim errors rising |
| Factual error rate | Corrections caught pre-publish vs post-publish | Pre-publish catch rate stable or up | Customer-visible corrections increase |
| Editor minutes per asset | Human polish time after AI first draft | Down with stable rubric scores | Editors become rewriters |
Content teams evaluating assistants should compare outcomes across AI writing tools using the same rubric, not the same prompt demo. Marketing metrics fail when each pilot uses a different definition of "done."
Engineering Team Success Metrics
Engineering success shows up in lead time, defect rate, and review burden. AI coding assistants may shorten typing time while increasing review comments or test gaps. Measure total path to merged code, not characters generated.
| Metric | Definition | Adopt signal | Reject signal |
|---|---|---|---|
| Lead time to merge | Open to merged on assisted PRs vs baseline | Median stable or down | Review cycles increase |
| Defect rate post-merge | Incidents or bugs tied to assisted changes | No increase vs control period | Repeat security or logic failures |
| Review comment density | Substantive comments per assisted PR | Flat or down with same coverage | Reviewers flag AI-shaped boilerplate |
| Test coverage delta | Tests added or updated on assisted work | Coverage maintained or improved | Merged code with thinner tests |
Building a Team Scorecard in Five Steps
- Name one workflow per scorecard; avoid org-wide averages.
- Capture baseline for two weeks before AI accounts exist.
- Pick two to four metrics from the tables above; write adopt and reject thresholds.
- Assign reviewer who scores quality during normal work, not a separate audit.
- Review monthly with workflow owner; one fix, one experiment, one watch metric.
Operations and Finance Metrics
Operations and finance teams assist reporting, procurement summaries, and internal comms. Their AI metrics should emphasize accuracy and auditability over creative speed.
| Function | Primary metrics | Reject signal |
|---|---|---|
| Operations | Exception detection rate, reconciliation errors, cycle time | Missed exceptions vs manual baseline |
| Finance | Variance explanation accuracy, review minutes, audit findings | Numbers that fail spot-check against source |
| People ops | Policy-compliant drafts, time to first draft, escalation rate | Tone or compliance flags from legal review |
Cross-Team Reporting Without Averaging Away Truth
Roll up budget and seat count at org level. Roll up success only as a traffic light per workflow: green adopt, yellow watch, red reject. Never average CSAT with brand rubric scores. Executives see portfolio health; teams keep numeric detail that drives behavior.
Marketing pilots tied to AI marketing campaigns should report separately from support macros even when both use the same vendor login. Shared licenses are not shared success definitions.
Monthly Metrics Review Template
Run this forty-five minute review per workflow with the team owner, not the whole department.
- Penetration (10 min): Share of eligible cases using the AI step this month vs target.
- Quality (10 min): First-pass acceptance trend and top three failure modes.
- Outcome (10 min): Cycle time, throughput, or error rate vs baseline band.
- Cost (5 min): Subscription plus review labor per accepted output.
- Actions (10 min): One process fix, one training fix, one metric to watch next month.
Marketing teams comparing assistants in AI marketing should run the same review template for each finalist during eval, not only after purchase. Early metric discipline prevents renewals based on demo excitement.
Writing Thresholds That Drive Decisions
Thresholds should force a yes or no at pilot end. Vague improvement language lets failing tools limp into renewal. Use bands, not point estimates.
| Team | Adopt if | Reject if |
|---|---|---|
| Support | Handle time down 10 to 20% with CSAT within 0.5 points | Escalations up or major rewrites on most drafts |
| Marketing | Cycle time down with rubric scores stable | Editor time up or factual errors increase |
| Engineering | Lead time flat or down with review burden flat | Defects or review comments rise on assisted PRs |
Content teams sourcing tools from AI writing directories should apply the same threshold table before comparing feature lists. Features without metric clearance become shelfware with good demos.
Frequently Asked Questions
How do we set baselines fairly?
Sample ten to twenty recent jobs per workflow before rollout. Record median time, revision rounds, and quality scores using the same rubric you will use after adoption. Note seasonality: retail support spikes in Q4, marketing compresses before launches. Compare pilot windows to similar periods, not arbitrary calendar months.
How do we attribute outcomes when multiple tools touch one workflow?
Attribute to the workflow step, not the vendor brand. If outline AI and grammar AI both run, measure total work time and final quality at the workflow level. Split vendor attribution only when running explicit A/B pilots on the same step.
Our team is six people. Do we need four metrics?
Use two metrics plus qualitative notes. Small teams still need written thresholds to avoid renewal by vibes. Median total work time and first-pass acceptance cover most cases.
Executives want one ROI number. What do we give them?
Cost per accepted output for prioritized workflows plus a count of green workflows. Provide ranges, not false precision. Pair with risk events per thousand outputs so speed never hides quality collapse.
Can we change metrics mid-pilot?
Only if the workflow definition changed or baseline data was wrong. Document the change on the decision memo and reset the pilot clock. Mid-pilot metric shopping is how failing tools get renewed.
Seasonality and Baseline Windows
Compare pilot results to baselines from similar workload periods. Support baselines taken during a product launch week will make a normal month look like a win. Marketing baselines during quiet season will hide editor rework during campaign crunch. Document the baseline window on the scorecard header.
If seasonality prevents a fair comparison inside a two-week pilot, extend the measurement window while keeping tool and workflow constant. Do not change tools mid-comparison and call it the same pilot.
One-page scorecard template
Keep each workflow scorecard to one screen: workflow name, owner, baseline window, two to four metrics with adopt and reject bands, last month value, trend arrow, and next action. Long scorecards do not get updated. Store scorecards where monthly reviews happen, not in a folder nobody opens after kickoff.
Review scorecards in the same meeting where workflow owners report adoption, not in a separate metrics workshop nobody attends. Shared airtime keeps numbers tied to decisions.
The Bottom Line
Drop generic time saved. Define two to four workflow metrics per team: support focuses on handle time, CSAT, and escalation; marketing on cycle time, brand compliance, and errors; engineering on lead time, defects, and review burden. Capture baselines, write adopt and reject thresholds, and report portfolio health without averaging incompatible outcomes. Buy seats in AI writing and marketing categories only when your scorecard says the workflow cleared them.