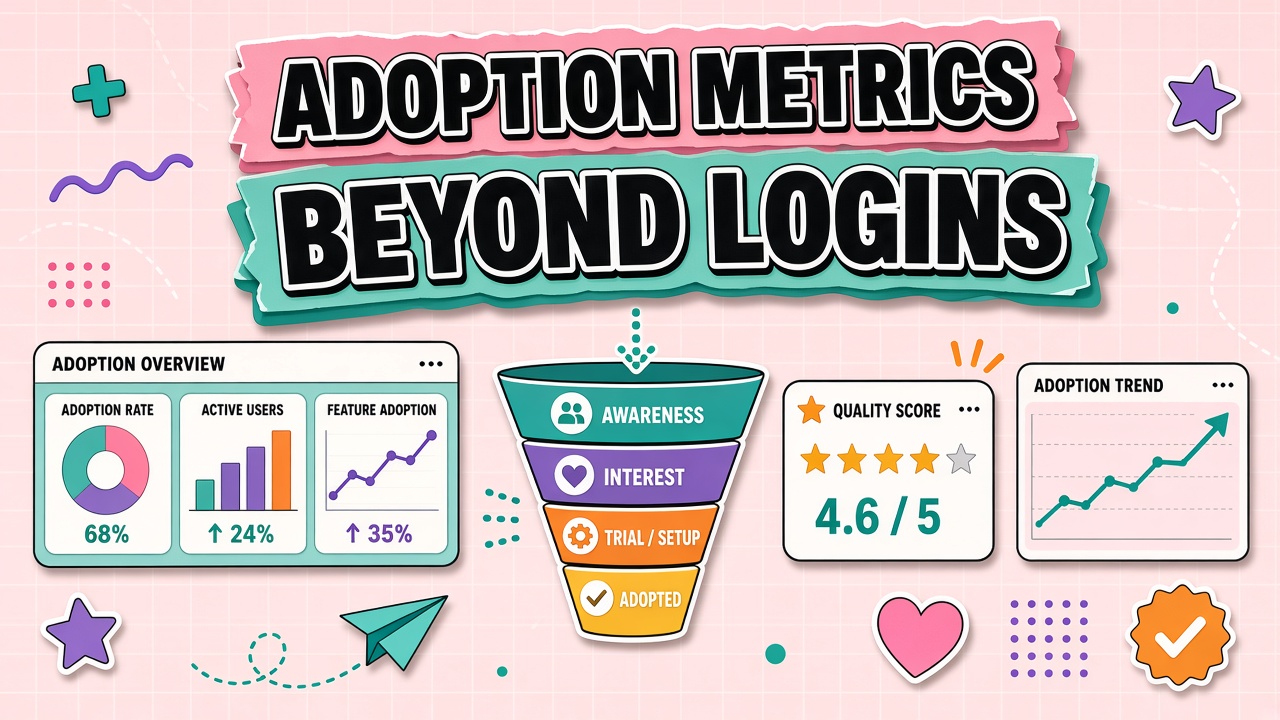
Dashboards full of login counts create a dangerous illusion. Everyone has access, a few power users generate impressive prompt volume, and leadership concludes the rollout succeeded. Meanwhile, the weekly report still takes the same three hours because reviewers do not trust AI drafts enough to ship them.
To measure AI tool adoption accurately, track whether work actually changes: workflow penetration, first-pass quality, voluntary repeat use, and business outcomes tied to named processes. This guide gives you a metrics dashboard spec with leading and lagging indicators, plus a monthly review agenda. Explore workflow candidates in AI productivity tools and AI automation tools only after you define what "adopted" means for your team.
Leading vs Lagging Adoption Indicators
Lagging indicators tell you what already happened: active users, prompts sent, tasks completed, time saved estimates, and ROI on redesigned workflows. Leading indicators predict whether adoption will stick: sponsorship visibility, training completion, individual readiness, implementation risk scores, and reinforcement alignment with how managers actually review work.
During the first two quarters of a rollout, weight leading indicators heavily because usage data is thin and easy to misread. After workflows stabilize, shift toward lagging outcome metrics while keeping a small leading panel to catch regression early.
| Layer | Example metrics | Review cadence |
|---|---|---|
| Leading: readiness | Training completion, manager modeling, policy acknowledgment | Weekly during rollout |
| Leading: activation | 30/60/90-day repeat use on real tasks | Monthly |
| Lagging: workflow | Penetration, cycle time delta, rework rate | Monthly |
| Lagging: business | Throughput, cost per output, risk events per volume | Quarterly |
Workflow Completion and Time-Saved Tracking
Workflow completion tracking asks a simple question: did the AI-assisted path finish the job end to end? Measure penetration as the percentage of eligible cases in a named process that include an AI-supported step. A support team might target fifty percent of tier-one replies drafted with AI assistance. A marketing team might target eighty percent of briefs started from an AI outline that a human editor finalizes.
Time-saved estimates work when tied to a baseline. Record median minutes per job before AI, then sample ten to twenty completed jobs per week after adoption. Multiply median savings by weekly volume for a defensible range, not a precise false precision. Always subtract rework time. A draft produced in two minutes that needs twenty minutes of correction is not a win.
Quality Scoring for AI-Assisted Output
Quality scoring makes adoption honest. Use a lightweight rubric reviewers apply during normal work, not a separate audit project. A five-point checklist works well: factual accuracy, completeness against the brief, tone and brand fit, policy compliance, and residual risk notes.
Track first-pass acceptance rate: outputs approved with minor edits only. Track rework rate: outputs sent back for major revision or discarded. Compare scores by team, tool, and prompt template to find where training or process fixes help more than another subscription.
Voluntary vs Mandated Usage Signals
Mandated usage produces activity. Voluntary usage produces learning. After the initial rollout window, compare who still uses the tool without reminders versus who stops the moment the mandate lifts. Include a skeptical cohort in pilots and watch whether their repeat usage grows.
Practical voluntary signals include repeat use in the same task family for three consecutive weeks, sharing prompt templates with peers, and requesting integrations that embed the tool into existing systems. Vanity signals include opening the app once for a demo, generating content never shipped, and executive dashboards that count prompts but not outcomes.
Monthly Adoption Review Agenda
Run a forty-five minute monthly review with the workflow owner, tool admin, and a representative practitioner. Bring one page per prioritized workflow with adoption, quality, and outcome metrics.
- Activation check (5 minutes): Who has access vs who used the tool on real work this month
- Workflow penetration (10 minutes): Share of eligible cases using AI-supported steps
- Quality trends (10 minutes): First-pass acceptance and top failure modes
- Outcome delta (10 minutes): Cycle time, throughput, or error rate vs baseline
- Leading indicators (5 minutes): Training gaps, policy questions, manager reinforcement
- Actions (5 minutes): One fix, one experiment, one metric to watch next month
Building Your Adoption Dashboard
Start with one spreadsheet tab per prioritized workflow. Columns: eligible cases this month, cases with AI step, first-pass acceptance rate, median cycle time, rework rate, voluntary repeat users, and notes. Update weekly during rollout, monthly after stabilization. Graduate to BI tools only when the manual version has run cleanly for two months.
Segment every metric by team and role. A company-wide active user count hides the support team that never adopted while engineering looks successful. Segmentation also reveals champions worth inviting to office hours and departments that need workflow redesign before another tool purchase.
Sample metrics for support and marketing
Support might track tier-one reply drafts assisted by AI, median handle time on those tickets, escalation rate after AI draft, and customer satisfaction on AI-assisted threads. Marketing might track briefs started from AI outlines, editor minutes saved, publish cycle time, and brand rubric scores on final posts.
Both functions should record when AI was skipped despite eligibility. Skipped cases often reveal policy confusion, integration friction, or trust gaps more clearly than login dashboards.
Connecting adoption to ROI conversations
Finance cares about cost per accepted output, not prompts per user. Multiply monthly tool cost by workflow share, then divide by accepted outputs that month. Compare to baseline labor minutes saved using loaded hourly rates only when time studies exist. Honest ranges beat false precision.
Week One Adoption Baseline Capture
Before any rollout communication, capture baselines for each target workflow. Record median handle time, revision rounds, error or escalation rate, and throughput per week. Interview three practitioners about unofficial shortcuts and shadow tools. Baselines without shadow tool visibility understate how work really happens and overstate AI impact later.
Document data sources for each metric: ticket system timestamps, CMS publish logs, or time-tracked samples. When sources disagree, pick one system of record and note limitations. Changing measurement methods mid-rollout invalidates trend lines and triggers pointless arguments in monthly reviews.
Red flags in adoption dashboards
Rising logins with flat throughput suggests performative use. Falling first-pass acceptance after a model update signals prompt or policy drift. Concentrated usage in one hero user while peers stay idle indicates training or workflow fit problems, not a successful team rollout. Spikes in skipped eligible cases often precede security incidents or policy confusion; investigate immediately rather than celebrating lower API cost.
Frequently Asked Questions
How do we track adoption without invasive surveillance?
Prefer aggregate telemetry and artifact sampling over keystroke monitoring. Admin consoles can show active users and feature events at team level. Reviewers can score a weekly sample of outputs during normal QA. Anonymous pulse surveys capture confidence without tying scores to individuals. Document what you collect and why in your AI usage policy.
How do we prevent gaming adoption metrics?
Pair activity metrics with outcome metrics. If prompt volume rises but first-pass acceptance falls, investigate prompt spam or low-stakes busywork. Require workflow owners to attest that penetration numbers reflect production work, not test prompts. Rotate sampling reviewers so scoring stays consistent.
What if our team is too small for statistical dashboards?
Use a spreadsheet with five rows: workflow name, baseline, current median, quality score, and decision. Small teams still benefit from explicit baselines and monthly conversation. Qualitative notes from practitioners often matter more than false precision at ten-person scale.
How do we compare adoption across multiple AI tools?
Normalize by workflow, not by tool login page. Two tools in the same category should compete on penetration, quality, and cost per accepted output for the same job. Retire or consolidate the tool that wins fewer workflows despite similar features.
90-Day Adoption Scorecard
Day thirty: activation rate among eligible users, first successful workflow completion, training completion. Day sixty: repeat usage without reminders, workflow penetration above twenty percent of eligible cases, stable or improving quality rubric. Day ninety: measurable cycle time or throughput delta, voluntary library contributions, sponsor attestation that workflow changed sustainably.
Miss day-thirty activation? Fix access, training, and manager modeling before buying more seats. Miss day-sixty penetration? Revisit workflow fit and integration. Miss day-ninety outcomes? Stop or redesign before annual renewal locks spend.