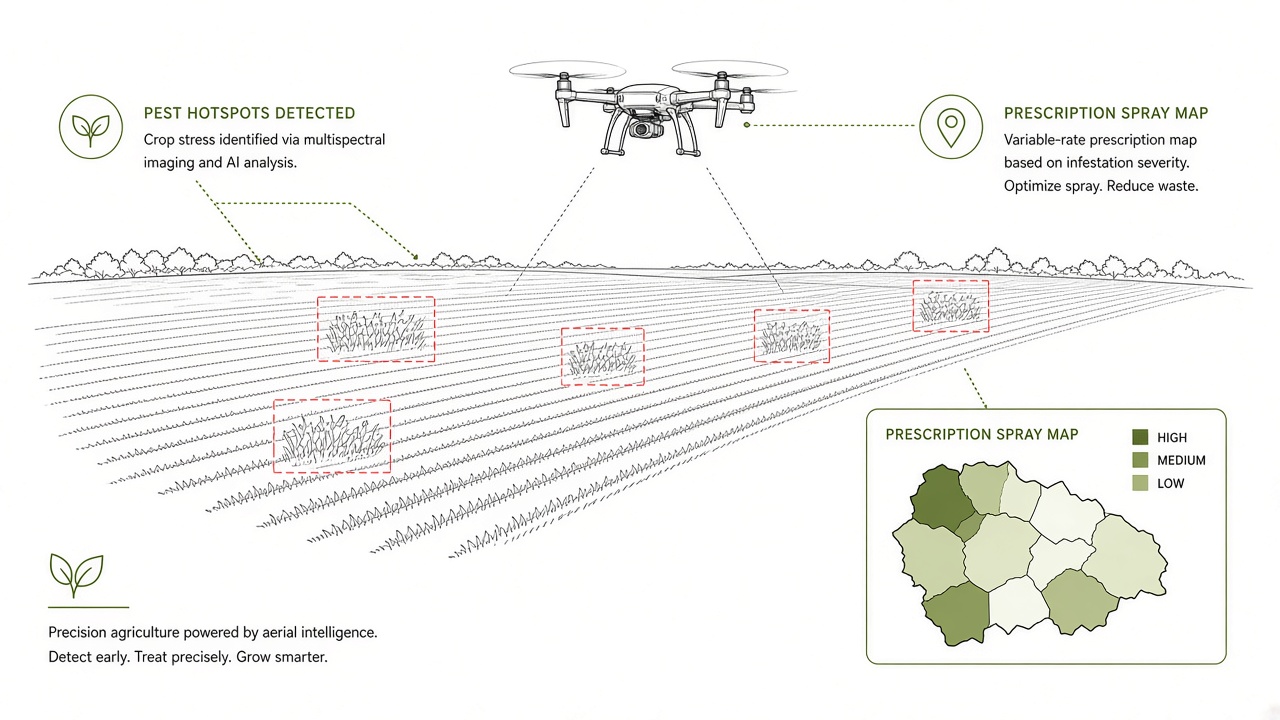
Row crop and orchard managers spray pesticides on calendar schedules or whole-field averages when insect pressure actually clusters in windbreak edges, wet corners, and volunteer host plants. Scout teams on foot cover fractions of large farms weekly, missing explosive outbreaks of stink bugs, Japanese beetles, or spotted wing drosophila (SWD) until economic thresholds are already exceeded. Pest detection drone agriculture AI applies unmanned aerial vehicle (UAV) imagery and edge object detection models to map pest presence, density, and crop damage at row scale before targeted treatment.
Agronomists, IPM consultants, and precision ag startups all ask the same question: can a drone flight replace enough scouting hours to pay for itself in reduced chemical costs? Product teams exploring AI chatbot interfaces for field operations should ground answers in published detection benchmarks and flight-condition limits, not universal 99 percent accuracy claims. More explainers live on the EliteAI.tools blog index.
What Drone Pest Detection AI Means in Plain Language
Drone pest detection AI is the use of computer vision models trained on aerial or close-range crop imagery to identify insect species, count individuals, or score feeding damage, then georeference results into prescription maps for variable-rate spraying or manual scouting follow-up. Detection is not automatic pesticide application: maps inform integrated pest management (IPM) decisions that still weigh beneficial insects, pre-harvest intervals, and regulatory label rates.
UAV workflows capture RGB, multispectral, or thermal frames at low altitude with ground sampling distances small enough to resolve individual insects or characteristic leaf skeletonization. Models range from lightweight Tiny-YOLO variants on NVIDIA Jetson TX2 boards for onboard inference to YOLOv5s ensembles detecting multiple pest classes in a single pass. Flight timing, sun angle, and crop stage strongly affect usable imagery.
| Pest or damage type | Typical imagery | Decision output |
|---|---|---|
| Stink bugs (H. halys) | Close RGB on fruit and foliage | Hotspot maps for border sprays |
| Multi-class field pests | UAV RGB mosaics | Class counts for threshold alerts |
| Japanese beetle feeding | Leaf damage spectral signatures | Damage index correlated to scouts |
| Spotted wing drosophila | Trap and canopy proximity flights | Risk zones; often needs ground traps |
How the Drone Pest Detection Pipeline Works
A drone pest detection pipeline plans flight lines, captures geotagged imagery, stitches orthomosaics or processes frame streams, runs object detection or damage regression models, exports georeferenced pest layers, and integrates with farm management software for scout routing or variable-rate applicator files. Edge inference on Jetson TX2-class hardware enables real-time alerts during flight for time-sensitive orchard work.
Brown marmorated stink bug (H. halys) detection
Models targeting brown marmorated stink bug (Halyomorpha halys) on orchard and row crops report detection rates around 97 percent in published UAV and close-range imaging studies under favorable lighting. Stink bugs aggregate on field edges and late-season fruit clusters; aerial maps help concentrate sprays away from field centers where counts fall below economic thresholds. Detection rate is not the same as species specificity across lookalike shield bugs without curated training sets.
YOLOv5s multi-pest detection
YOLOv5s models trained to detect five agricultural pest classes simultaneously report mean average precision (mAP) near 95 percent on benchmark image sets in peer-reviewed evaluations. Multi-class heads reduce repeated flights when aphids, caterpillars, and beetles co-occur, though class imbalance still favors common species unless training data is stratified. mAP summarizes ranking quality across IoU thresholds; field agronomists still validate with ground counts before wide-area spray commitments.
Tiny-YOLOv3 on Jetson TX2 edge inference
Tiny-YOLOv3 deployments on NVIDIA Jetson TX2 modules enable onboard inference during UAV flight, reducing latency for live hotspot overlays on pilot tablets. Compact models trade some accuracy for frames per second and watt draw limits on small quadcopters with short flight batteries. Edge pipelines suit orchards where immediate respray decisions must happen before wind shifts or rain washoff.
Japanese beetle damage indexing
Japanese beetle feeding damage detected from UAV imagery correlates with manual scout ratings at Pearson coefficients between 0.89 and 0.96 in published vineyard and specialty crop trials, indicating aerial damage indices track human severity scores closely when leaf skeletonization is visible at chosen ground sampling distance. Correlation strength drops when early feeding mimics other defoliators unless models include temporal growth patterns.
Spotted wing drosophila: UAV limits versus static monitoring
Spotted wing drosophila (SWD) monitoring comparisons show UAV-based approaches achieve lower area under the curve (AUC) than static trap networks for predicting population peaks in published cherry and berry studies. Small fly body size, canopy penetration limits, and trap pheromone specificity favor ground trap grids supplemented by UAV damage surveys rather than fly detection from altitude alone. IPM programs should treat drone SWD maps as risk hints, not replacements for fermenting trap counts.
- Define target pest, crop stage, and economic threshold with certified crop advisor input.
- Plan flight altitude and overlap for ground sampling distance resolving pests or damage features.
- Capture RGB or multispectral imagery; radiometrically calibrate when using vegetation indices.
- Run detection or damage models; validate hotspot counts with ground scouts on the same day.
- Export prescription shapefiles for variable-rate sprayers or manual crew routing.
- Log treatment outcomes and retrain models on regional pest pressure shifts each season.
Published Evidence and Field Deployments
UAV pest AI studies report high detection rates and mAP on curated image sets, but performance drops when lighting, flight height, or co-occurring pests differ from training conditions. H. halys detection near 97 percent and YOLOv5s five-pest mAP near 95 percent demonstrate feasibility for targeted orchard and row crop IPM when imagery quality is controlled. Japanese beetle damage Pearson correlations of 0.89 to 0.96 support using aerial damage indices to prioritize scout time.
SWD results caution against over-generalizing: lower UAV AUC than static traps means berry growers should keep fermenting trap grids while using drones for canopy damage and ripening zone mapping. Jetson TX2 Tiny-YOLOv3 deployments show edge inference is operationally mature for live flight overlays, though battery and regulatory line-of-sight rules still constrain daily acreage covered.
Crop protection companies partner with drone service providers to bundle flights with model updates per region. Buyers should demand external validation on their crop and pest mix, not vendor global metrics from dissimilar geographies.
Regulatory and spray application context
FAA Part 107 or equivalent national UAV rules, pesticide label requirements, and buffer zones near waterways still govern whether a pest map leads to legal application. Prescription files must align with applicator hardware and chemistries registered for the crop. Organic operations face tighter material lists; pest maps help document need but do not waive pre-harvest intervals or beneficial insect refuge requirements.
Orthomosaic versus streaming inference workflows
Post-flight orthomosaic pipelines stitch thousands of frames into georeferenced mosaics before running YOLOv5s or H. halys detectors offline on GPU workstations. Streaming Tiny-YOLOv3 on Jetson TX2 during flight trades mosaic completeness for immediate pilot feedback when orchard rows must be re-sprayed before weather closes the application window. Hybrid workflows stream for triage and build mosaics overnight for prescription export to variable-rate controllers. Ground sampling distance chosen during flight planning determines whether individual H. halys adults resolve or only cluster hotspots appear.
Ground truth and scout validation protocol
Published Pearson correlations of 0.89 to 0.96 for Japanese beetle damage assume same-day ground counts on flagged rows. IPM programs should document scout routes, beat-sheet counts, and trap catches alongside drone layers so agronomists can compute false positive rates per season. When YOLOv5s mAP near 95 percent comes from benchmark stills, field teams still need random ground plots outside model hotspots to catch false negatives that aerial views miss under canopy closure.
Limits, Risks, and Ethical Guardrails
Models trained on midwestern corn pests may miss western specialty crop insects or misclassify beneficial predators as threats when bounding boxes overlap. A 97 percent detection rate on benchmark stills does not translate to 97 percent of all field acres correctly classified under cloudy skies and motion blur.
- Flight conditions: Wind and glare reduce usable frames; repeated flights add cost.
- Species confusion: Shield bugs and stink bugs look similar at low resolution.
- Beneficial insects: Blanket spray maps from false positives kill parasitoids and pollinators.
- Data labeling cost: Regional pest variants need continuous annotation budgets.
- Privacy: Repeated low-altitude flights over rural residences raise neighbor concerns.
Ethical IPM guardrails require scout confirmation before first spray in a zone, preserve untreated refuges when labels allow, document model version and threshold rationale for audit trails, and avoid marketing drone maps as eliminating human agronomist judgment entirely.
Smallholder farms without variable-rate applicators still benefit from scout routing maps even when sprayers remain uniform-rate. Extension programs should price drone services against labor savings and chemical reduction jointly, not chemical savings alone.
Beneficial insect refugia and drift buffers
IPM plans that use H. halys hotspot maps for border sprays should preserve refugia for parasitoids and pollinators by avoiding whole-field applications when interior YOLOv5s counts stay below thresholds. Drift buffers near waterways remain mandatory regardless of model confidence; prescription shapefiles must clip to label setbacks. Documenting drone-detected pressure alongside actual spray records supports organic certification audits when inspectors question whether treatments were justified.
Who Should Use This and Who Should Wait
Orchard, vineyard, and high-value row crop operators facing mobile pests like H. halys or Japanese beetle with variable-rate spray equipment should adopt YOLO-class drone mapping with ground validation now. Berry growers monitoring SWD should prioritize trap networks and treat UAV layers as supplemental until fly detection AUC improves.
| Audience | Recommendation | Caveat |
|---|---|---|
| Tree fruit orchard (stink bug pressure) | Deploy H. halys-focused UAV detection with border spray maps | Validate 97% benchmarks on your cultivar and row spacing |
| Diverse row crop IPM program | Use YOLOv5s multi-pest models plus scout confirmation | Rare classes need extra local labels |
| Vineyard Japanese beetle management | Track damage indices with Pearson 0.89 to 0.96 correlation workflows | Early season damage may be ambiguous |
| Berry SWD program | Keep static traps primary; UAV for canopy risk mapping only | UAV AUC lower than traps in published studies |
Frequently Asked Questions
What does 97 percent H. halys detection mean?
It means the published model correctly detected brown marmorated stink bug instances on about 97 percent of labeled test images under study conditions, not that 97 percent of all orchard acres require treatment. Ground scouts should confirm hotspots before spraying.
How strong is YOLOv5s 95 percent mAP for five pests?
mAP near 95 percent indicates strong ranking of bounding boxes across five pest classes on the benchmark dataset used in the paper. Transfer to your fields requires local validation flights and label updates for regional species mixes.
Why run Tiny-YOLOv3 on Jetson TX2 during flight?
Onboard inference reduces latency for pilot tablet overlays and avoids uploading full video when rural bandwidth is limited. Compact models sacrifice some accuracy versus larger YOLO variants run offline on stitched mosaics.
Are Japanese beetle damage maps reliable?
Pearson correlations of 0.89 to 0.96 with manual scouts in published trials support using UAV damage indices to prioritize rows for inspection. Correlation is not causation for yield loss; tie thresholds to economic injury levels.
Should drones replace SWD traps?
No for population monitoring: published studies report lower AUC for UAV SWD detection than static trap networks. Use traps for peak timing and drones for canopy damage or ripening zone logistics.
Do I need variable-rate sprayers to benefit?
Prescription maps still save labor when scouts walk flagged zones first, but chemical savings scale best with variable-rate or spot-spray equipment. Uniform-rate farms gain primarily from reduced scouting time and avoided whole-field sprays when hotspots are absent.
When does drone pest AI pay back investment?
Payback depends on acres flown, scout hourly cost, and chemical avoided when H. halys border sprays replace full-field applications; orchards with recurring stink bug pressure see faster returns than row crops with sporadic YOLOv5s detections. Model vendor fees and pilot labor should enter the same spreadsheet as mAP benchmarks.
How often should drone pest models be recalibrated?
Retrain or fine-tune at least once per growing season and after major crop stage shifts, because canopy closure changes ground sampling distance and lighting for H. halys and Japanese beetle damage indices. Log false positives from scout follow-up to prioritize new labels.
Conclusion
Pest detection drone agriculture AI maps insect pressure and feeding damage before blanket sprays, with H. halys detection near 97 percent, YOLOv5s five-pest mAP near 95 percent, Tiny-YOLOv3 running on Jetson TX2 for live flight inference, Japanese beetle damage correlating with scouts at Pearson 0.89 to 0.96, and SWD workflows reminding growers that UAV AUC trails static traps. Seasonal recalibration, beneficial insect refugia, and scout confirmation keep IPM programs legally and ecologically sound. Use drone maps to focus scouts and sprayers, confirm thresholds on the ground, and never treat benchmark detection rates as guaranteed chemical savings without your applicator economics modeled honestly.