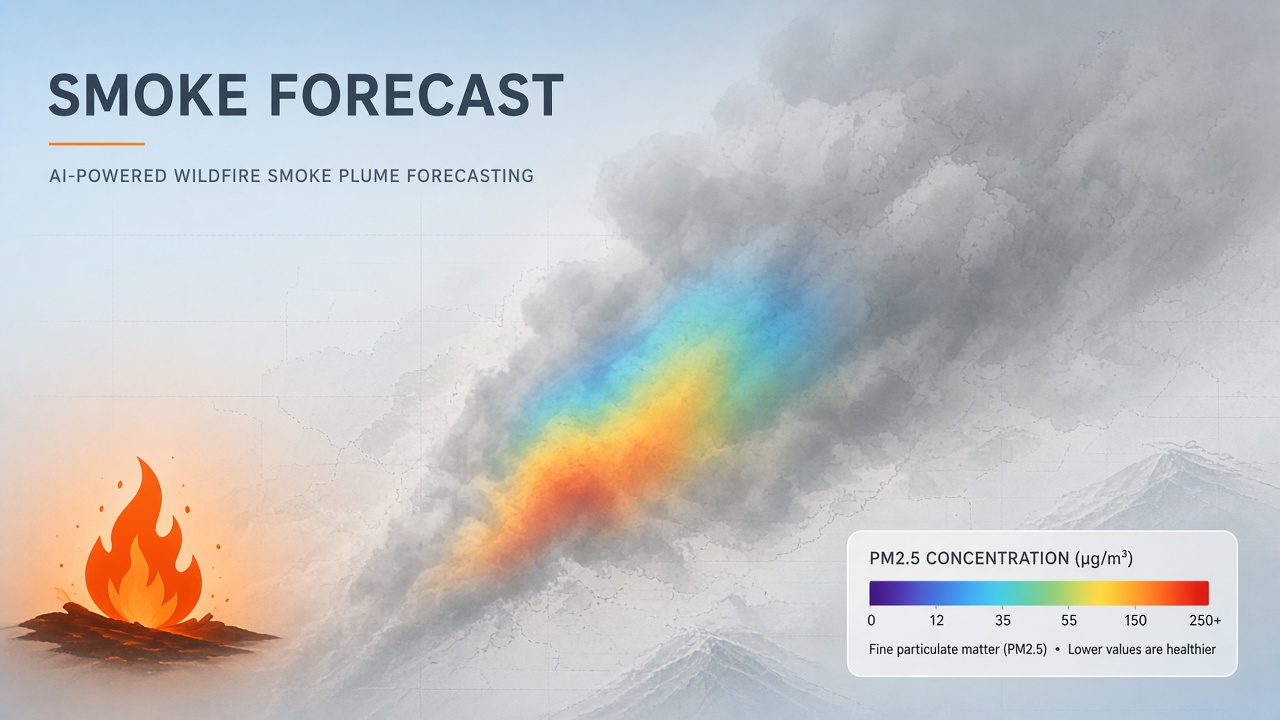
Residents three hundred miles from an active wildfire wake to hazy skies and air quality index readings in the unhealthy range, even though no flame is visible from their neighborhood. Smoke travels on upper-level winds, descends into valleys overnight, and concentrates PM2.5 far from the fire perimeter. Predicting where that plume will move next is a coupled problem of fire intensity, meteorology, chemistry, and terrain. Wildfire smoke AI forecast systems combine operational physics models like NOAA HRRR-Smoke with machine learning layers that bias-correct outputs, predict fire spread, and fuse satellite and ground sensor data into hyperlocal air quality estimates.
Public health agencies, schools, airlines, and outdoor event planners depend on these forecasts during fire season. Developers building alert bots or health advisories through AI chatbot interfaces should understand which model layer supplies the numbers users see. For more research explainers on AI applied to real-world systems, visit the EliteAI.tools blog index.
What Wildfire Smoke AI Forecast Means in Plain Language
A wildfire smoke AI forecast estimates where smoke particles will travel, how high plumes will rise, and what ground-level PM2.5 concentrations communities should expect over the next hours to days. The core physics lives in numerical weather prediction coupled with smoke transport: fires emit particles, heat drives plume rise, and wind advects smoke through the atmosphere. AI enters when researchers train models to correct systematic errors in those physics simulations, predict how fires spread when satellite data goes dark, or merge model output with monitors and low-cost sensors at street scale.
Two smoke products matter for different decisions. Near-surface smoke estimates PM2.5 close to the ground where people breathe. Vertically integrated smoke sums aerosol mass through the entire atmospheric column, capturing high-altitude haze that turns skies milky white and affects aviation visibility even when ground air seems acceptable.
| Forecast product | What it measures | Primary decision use |
|---|---|---|
| Near-surface smoke | PM2.5 at roughly 8 m above ground | Health advisories, school closures, mask guidance |
| Vertically integrated smoke | Total column aerosol mass to ~25 km altitude | Sky color, aviation, solar radiation impacts |
| Fire radiative power (FRP) | Heat release from active fires (VIIRS, MODIS) | Emission rate inputs for dispersion models |
How the Underlying AI Pipeline Works
Operational smoke forecasting pipelines chain satellite fire detection, emissions estimation, plume rise parameterization, and weather-driven transport; machine learning modules then correct biases or fill gaps where physics alone underperforms. Understanding each stage clarifies where AI adds value versus where trusted physics models remain essential.
NOAA HRRR-Smoke: the operational backbone
NOAA's High-Resolution Rapid Refresh coupled with Smoke (HRRR-Smoke) runs at 3 km horizontal resolution over the continental United States, initializing every hour with fresh fire radiative power from VIIRS and MODIS satellites. The model couples the HRRR weather forecast (winds, temperature, humidity, boundary layer height) with biomass burning emissions and smoke modules. Forecast length reaches 18 to 48 hours. A companion RAP-Smoke model covers a broader domain at 13.5 km. HRRR-Smoke-AK serves Alaska at 3 km with 3-hourly updates.
During initialization, HRRR-Smoke ingests FRP detected over the prior 24 hours, applies diurnal fire cycles, simulates plume rise, and advects smoke in three dimensions. NOAA's Global Systems Laboratory continuously evaluates near-surface smoke against AirNow PM2.5 monitors and vertically integrated smoke against satellite aerosol optical depth using the MONET evaluation toolkit.
NASA GEOS-CF: global composition context
NASA's GEOS Composition Forecast (GEOS-CF) system provides global aerosol and trace gas forecasts, offering context when smoke crosses international boundaries or when regional models lack coverage. GEOS-CF data is accessible via the NASA Center for Climate Simulation portal, a CFAPI for point queries, Google Earth Engine collections, and an interactive map tool that exports time series for any latitude-longitude pair. Regional HRRR-Smoke excels at mesoscale detail over complex U.S. terrain; GEOS-CF fills the global gap for trans-Pacific events and baseline chemistry.
Google air quality and wildfire ML
Google's air quality model fuses governmental monitors, commercial sensor networks, dispersion models, fire smoke layers, satellite data, traffic, and land cover into hyperlocal AQI estimates available in Maps and the Air Quality API with up to 96-hour hourly forecasts. The model weights input layers dynamically rather than trusting any single source. Google's FireBench project released high-fidelity wildfire simulation datasets to advance machine learning fire spread research, supporting community model development even though FireBench itself is a simulation corpus, not an operational forecast product.
ML bias correction and multi-source fusion
Physics models systematically misestimate PM2.5 during extreme smoke events. Recent studies integrate WRF-Chem output with satellite fire data and ground monitors, using Random Forest or XGBoost to bias-correct model PM2.5 before forecasting. The rapidfire R package fuses AirNow monitors, satellite observations, meteorological models, operational smoke forecasts, and PurpleAir sensors with random forest regression to produce rapid post-event exposure maps for epidemiology.
NOAA's Fire Intensity and spRead forecAst (FIRA) model uses machine learning to predict how fire perimeters and FRP evolve over forecast horizons, addressing a key HRRR-Smoke limitation: satellite FRP is unavailable for future timesteps, so operational models often assume persistent non-spreading fires. FIRA achieved R-squared near 0.7 on fire spread tests and improved UFS-Smoke simulations when substituted for static fire inputs.
| System | Role | AI component | Coverage |
|---|---|---|---|
| HRRR-Smoke | Operational 3D smoke dispersion | Physics-based (ML in evaluation) | CONUS, Alaska (3 km) |
| GEOS-CF | Global aerosol composition | Assimilation and forecast (NASA GMAO) | Global |
| Google Air Quality | Consumer and API hyperlocal AQI | Multi-layer fusion model | Select regions globally |
| FIRA | Dynamic fire spread for AQF inputs | ML fire intensity and spread | Research toward operations |
| rapidfire | Post-event exposure mapping | Random forest fusion | Retrospective (U.S. focus) |
End-to-end forecast pipeline stages
- Detect active fires from VIIRS, MODIS, or geostationary sensors; estimate FRP.
- Optionally predict fire spread with ML (FIRA) when persistence assumptions fail.
- Calculate emissions and plume injection height from FRP, vegetation, and meteorology.
- Run coupled weather-smoke model (HRRR-Smoke, GEOS-CF, or WRF-Chem variants).
- Apply ML bias correction using ground monitors and satellite AOD where trained.
- Downscale or fuse with low-cost sensors for street-level products (Google AQ, research tools).
- Publish near-surface and column products; evaluate against AirNow and satellite truth.
Real Deployments and Published Evidence
HRRR-Smoke has been NOAA's operational smoke forecast standard since 2020, used by National Weather Service forecasters, AirNow, and emergency managers during western U.S. fire seasons. NOAA Global Systems Laboratory case studies compare model output against wildfire events, refining how VI smoke identifies elevated plumes that do not always correlate with ground PM2.5 spikes.
Google's Air View+ initiative in India demonstrates operational hyperlocal AQI fusion combining government monitors, sensor networks, satellite imagery, weather, traffic, land cover, and fire smoke signals for Maps users and municipal dashboards. The Air Quality API exposes 96-hour hourly forecasts with pollutant concentrations and health recommendations for developers building alert applications.
Peer-reviewed evidence supports ML augmentation rather than replacement of physics cores. A 2024 biomass burning study in northern Thailand found Random Forest bias correction of WRF-Chem PM2.5 outperformed raw model output (correlation 0.867 vs lower uncorrected scores) during haze season. rapidfire exposure maps for California wildfire events from 2017 to 2021 showed strong agreement with independent filter-based measurements. FIRA improved UFS-Smoke simulations for a September 2020 California fire case when dynamic fire inputs replaced static satellite snapshots.
Who consumes these forecasts today
- Public health departments: Issue smoke health advisories and shelter guidance.
- School districts: Cancel outdoor sports when near-surface PM2.5 exceeds thresholds.
- Aviation: Plan around vertically integrated smoke and visibility restrictions.
- Utilities: Anticipate solar generation drops from aerosol attenuation.
- Epidemiologists: Assign population smoke exposure with rapidfire-style retrospective fusion.
Limits, Risks, and Ethical Guardrails
Smoke forecasts inherit errors from every upstream input: missed small fires, wrong wind timing, incorrect plume rise, and sparse monitor networks in rural impact zones. Near-surface smoke can read "good" while elevated plumes still degrade visibility and mental health. Conversely, models may overpredict ground impacts when smoke stays aloft.
- Fire input uncertainty: Operational models assume persistent fires when satellites cannot see future hotspots.
- Terrain and nocturnal drainage: 3 km grids smooth valley inversions that trap smoke overnight.
- Sensor gaps: ML fusion improves cities with PurpleAir density; rural areas remain monitor-sparse.
- Latency: Research fusion tools like rapidfire target retrospective epidemiology, not same-hour alerts.
- False precision: Hyperlocal AQI in Maps feels exact; users should treat forecasts as probabilistic guidance.
Ethical guardrails include communicating forecast uncertainty in public alerts, prioritizing vulnerable populations (children, elderly, respiratory conditions) in advisory language, and avoiding alarm fatigue through calibrated threshold policies. Agencies should cite model source (HRRR-Smoke vs fused consumer products) when legal or health liability attaches to closure decisions.
Who Should Use This and Who Should Wait
Emergency managers, air quality agencies, and developers building regional alert integrations should use NOAA HRRR-Smoke and GEOS-CF directly or via AirNow APIs now, layering ML fusion only after local validation. Individual homeowners can rely on Google Maps AQI or AirNow for actionable guidance without running models.
| User type | Recommended approach | Wait if |
|---|---|---|
| County emergency manager | HRRR-Smoke via NWS, AirNow integration | N/A for core operations |
| Health app developer | Google Air Quality API or AirNow with attribution | Custom ML without meteorology expertise |
| Research epidemiologist | rapidfire or published fusion methods | Expecting real-time latency |
| ML startup (custom forecast) | Bias-correct HRRR-Smoke, validate on held-out fires | Launching without NWS forecaster review |
Teams outside NOAA and NASA coverage should lean on GEOS-CF global fields and regional WRF-Chem configurations validated for their geography. Consumer AQI products may not reflect local regulatory index definitions; India's Air View+ explicitly maps to National AQI categories. International deployers must verify categorization alignment.
Frequently Asked Questions
How accurate is HRRR-Smoke for ground-level PM2.5?
Accuracy varies by event: HRRR-Smoke captures large-scale transport well but can miss nocturnal drainage and small-fire emissions; NOAA continuously evaluates against AirNow monitors with documented case studies. Treat single-grid-cell values as guidance, not exact monitor readings. Compare forecast timelines with observations after each season to calibrate local trust.
Does AI replace weather-smoke physics models?
No. Current best practice uses physics models (HRRR-Smoke, GEOS-CF, WRF-Chem) for transport and adds ML for fire spread prediction, bias correction, and sensor fusion. Pure ML forecasts without physical constraints struggle on rare extreme events where training data is thin.
Where does Google get wildfire smoke data?
Google's air quality model lists fire smoke and dust models among weighted input layers alongside governmental monitors, sensor networks, dispersion models, satellites, traffic, and land cover. The Air Quality API returns hourly forecasts up to 96 hours with dominant pollutant and health recommendation fields.
How do I access NASA GEOS-CF smoke forecasts?
GEOS-CF files are on the NASA NCCS public portal; point queries use CFAPI; Google Earth Engine hosts select collections; the GEOS-CF map tool plots time series for clicked locations. Contact [email protected] for API access questions.
How far ahead can wildfire smoke AI forecasts predict?
HRRR-Smoke runs 18 to 48 hours ahead; Google Air Quality API provides up to 96 hours; uncertainty grows quickly beyond 24 hours as wind errors compound and fire persistence assumptions weaken. FIRA-style fire spread ML aims to extend credible fire inputs deeper into the forecast window.
Are smoke forecasts regulated?
Air quality standards are regulatory, but forecast products themselves are informational; agencies follow EPA and state protocols for official advisories while citing operational model sources. Developers republishing AQI should attribute data providers and avoid implying government endorsement without agreement.
Should I trust forecasts for indoor air quality?
Smoke forecasts target outdoor ambient air; indoor PM2.5 depends on building ventilation, filtration, and infiltration not captured in HRRR-Smoke or fused AQI products. Use outdoor forecasts to decide window sealing and HVAC settings, not as direct indoor measurements.
Conclusion
Wildfire smoke AI forecast systems layer machine learning on top of operational physics: NOAA HRRR-Smoke delivers high-resolution coupled weather-smoke guidance across the United States, NASA GEOS-CF extends global aerosol context, Google fuses multi-source signals into consumer and API products, and research tools like FIRA and rapidfire advance fire spread prediction and post-event exposure mapping. The strongest deployments treat physics models as the core, apply ML where data proves bias patterns, and communicate uncertainty to users making health and safety decisions. Builders integrating smoke data into applications should attribute sources, validate against local monitors, and reserve hyperlocal claims for regions with demonstrated fusion accuracy.