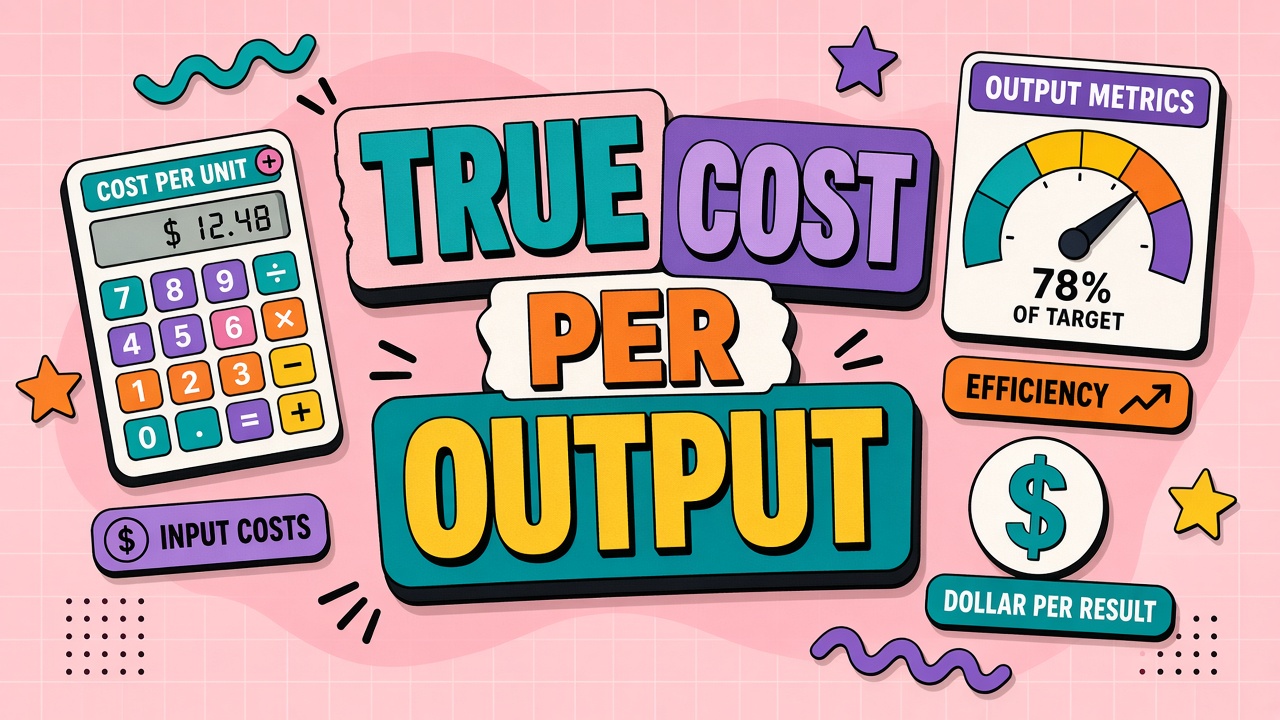
Vendor A shows lower per-token pricing. Vendor B costs more per call but produces acceptable drafts on the first try. Comparing list prices misleads. True cost per ai output divides total spend by artifacts your team actually ships: published articles, merged pull requests, or approved support replies.
Unit economics clarify whether a workflow is worth scaling. Finance and engineering should agree on what counts as usable output before debating tools. Teams in AI marketing and AI code assistant workflows often measure different success units; define yours explicitly.
Define "Usable Output" for Your Team
Usable output is an artifact that passes your quality gate without full rewrite. For marketing, a usable blog draft may require only light editing. For code, a merged PR with passing tests. For support, a reply sent without supervisor rewrite.
Document rejection reasons: off-brand tone, factual errors, policy violations. Outputs rejected entirely still consumed tokens; they belong in the denominator only if you track "attempt cost" separately from "success cost."
Avoid vanity metrics like raw generations or chat messages. They reward busy interfaces, not business outcomes.
Revisit definitions quarterly as quality bars rise. A draft that was usable in pilot may fail review after brand guidelines tighten.
Include Retries, Human Review, and Integrations
Total cost includes API spend, retry loops, human review minutes, and integration maintenance. A workflow that auto-retries three times on validation failure triples token burn before one usable JSON export.
Convert reviewer time to dollars using fully loaded labor rates. Even fifteen minutes of legal review per contract summary can exceed model cost for enterprise documents.
Amortize integration engineering: webhook handlers, eval harnesses, monitoring. Spread one-time build cost over expected outputs in year one.
Shadow costs matter too: duplicate tools doing the same task, manual copy-paste between systems because API integration was deferred.
Compare Workflows, Not Vendors
Vendor comparison asks which stack produces acceptable output cheapest for the same job. RAG plus small model may beat a large model alone for internal Q&A. Human-in-the-loop may beat full automation for regulated content.
Run parallel pilots with identical input sets. Measure usable output rate and total cost per success. Publish results internally to kill folklore about "cheaper" tools that need four edits per draft.
Workflow comparison also reveals when AI should not be used. Manual work may win for low-volume, high-stakes tasks even if per-token price looks attractive.
| Workflow | Usable unit | Cost components to include |
|---|---|---|
| Blog draft generation | Published post after editor approval | Tokens, retries, editor minutes, CMS integration |
| Code assistance | Merged PR passing CI | Seat fee, API overage, reviewer time, failed CI runs |
| Support reply | Sent ticket response without rewrite | Tokens, CRM plugin, QA sampling labor |
Track Trend Over Model Updates
Model updates change usable output rate overnight. Track cost per output weekly after vendor model swaps. A cheaper model that drops acceptance rate from eighty percent to fifty percent may increase true cost.
Version eval sets in git. Re-run golden prompts after each model change. Compare cost and quality side by side before promoting new defaults in production.
Alert when cost per output drifts more than fifteen percent without planned migration. Drift often signals prompt regression or routing misconfiguration, not just price list changes.
Worked Examples for Three Workflow Types
Marketing email generation: four thousand two hundred dollars API and image credits, twelve hundred dollars editor review, three hundred dollars integration amortization, six hundred twenty usable emails equals eight dollars per output. Support ticket drafts: two thousand one hundred dollars API, nine hundred dollars QA sampling, four hundred forty usable replies equals eight dollars per output. Code assistant PRs: six thousand dollars API, four thousand review and CI, one hundred ten merged PRs equals ninety-one dollars per output. Same formula, different quality gates explain why comparing vendors on token price alone misleads leadership.
Metric Pitfalls to Avoid
Pitfall one: counting raw generations instead of usable outputs inflates perceived productivity. Pitfall two: ignoring human review time makes AI look free while payroll shifts to editors. Pitfall three: blending batch and interactive workflows hides expensive batch failures. Pitfall four: snapshotting one good week after model upgrade without four-week trend invites nasty surprises at renewal.
Reporting Unit Economics AI Tools to Leadership
Present cost per output alongside volume and quality rate. A rising cost per output with flat quality means model or process regression. Falling cost per output with falling quality means false economy. Pair the metric with review rejection rate and customer escalation rate so finance and operations read the same chart.
Cost per AI Generation Trending
Store monthly snapshots in a data warehouse or simple ledger tab. Chart cost per output by workflow ID and model ID. When vendors ship new defaults, annotate the chart with vertical lines. Post-mortems after incidents should update the metric assumptions the same week, not at quarterly business review.
Implementing the Metric in Your Stack
Instrument applications to emit workflow_id, model_id, request_id, and outcome status (accepted, rejected, failed). Join billing export on request_id where vendors provide it; otherwise approximate with hourly aggregates per workflow. Add reviewer actions in product analytics: approve, edit heavily, reject. Map reviewer minutes from sample weeks. Publish cost per output weekly to workflow owners before monthly leadership review.
Start with one high-spend workflow rather than boiling the ocean. Prove the metric changes a decision: cap raise denied because cost per output rose while quality flat, or vendor kept because cost per output fell after routing change. Metrics without decisions die as dashboard vanity.
AI Output Cost Metric Governance
Define metric owner and definition version. When quality bar changes, bump definition version and reset trend chart. Compare v1 and v2 in parallel for one month to explain discontinuity. Without governance, leaders argue about numbers instead of fixing workflows.
Operational Checklist
Assign a single owner for monthly refresh. Publish assumptions where finance and engineering both edit. Tie forecast or policy changes to ticket IDs. Review variance before month close, not after invoice payment. Run tabletop exercises when vendors announce pricing or deprecations. Keep archived exports for audit comparison quarter over quarter.
Document decisions in plain language any new hire can follow. Operational discipline matters as much as spreadsheet formulas or contract clauses. Teams that treat AI spend as unplannable noise get unplannable invoices. Teams that treat spend as a managed metric catch drift early and negotiate from data.
Cross-Functional Alignment
Platform owns technical tags and caps. Finance owns forecast and chargeback posting. Procurement owns contract language. Product owns workflow rollout dates that drive usage. Security owns trial data classification. Weekly five-minute sync during rollout quarters prevents each function optimizing locally while global spend drifts. Alignment is boring work that prevents exciting overage surprises.
Common Mistakes to Avoid
Mistake one: single org-wide average hiding squad spikes. Mistake two: ignoring human review labor in ROI or unit economics. Mistake three: annual commit sized on peak pilot week. Mistake four: alerts configured without owners. Mistake five: sunset without migration support. Mistake six: treating free tier as production. Mistake seven: streaming timeouts fixed by disabling streams without root cause. Mistake eight: duplicate responses patched in UI only while webhooks still double-write. Avoiding these patterns saves more than marginal token discounts.
Metrics to Track Monthly
Track spend variance versus plan, tag coverage percentage, alert acknowledgment time, dispute count, unused license count, cost per usable output where applicable, stream completion rate for customer-facing apps, and duplicate side effect rate for integrated workflows. Pick three metrics primary for your pillar; log the rest as secondary. Review trend not single points. A metric without owner and target is dashboard decoration.
Share metrics with department leads in language they can act on. Finance sees dollars. Engineering sees error rates and timeouts. Product sees adoption and quality. Same underlying data, different emphasis, one source of truth export from vendor and internal logs reconciled monthly.
Implementation Timeline
Week one: assign owners and export baseline data from vendor admin or application logs. Week two: draft spreadsheet, policy, or runbook sections relevant to your pillar. Week three: pilot with one squad and fix tagging or alert noise. Week four: publish org-wide with office hours. Month two: first variance or true-up review and adjust assumptions. Month three: executive summary with decisions made from metrics, not only spend totals.
Skipping the pilot week creates alert fatigue and mistrust in chargeback numbers. Investing four weeks upfront pays back when finance, security, and engineering reference the same artifacts instead of rebuilding from scratch each quarter. Treat this as operational infrastructure parallel to the AI features themselves.
Frequently Asked Questions
How do batch jobs fit cost per output?
Define batch usable unit (processed row, classified ticket). Divide total batch cost by successful rows after error quarantine. Failed rows count in attempt metrics, not success metrics.
Should failed API runs count?
Yes in total workflow cost. Report separately as failure rate so engineering can fix retries and timeouts without hiding them inside a rosy per-success number.
We pay per seat, not per token. Adjust how?
Allocate seat cost across expected monthly usable outputs per seat. When utilization is low, per-output cost spikes even if token meter looks quiet.
What about brand risk from bad outputs?
Qualitative risk belongs in business case narrative, not the core metric. Document incidents and near-misses; high-stakes workflows may accept higher cost per output for lower risk.
Review this guide quarterly against your vendor admin console and finance exports. Interfaces change; caps move; new premium toggles appear inside familiar SKUs. A quarterly thirty-minute review keeps policy, forecast, and contract language aligned with what the product actually bills. Assign the review to a named role, not a mailing list.
When in doubt, measure for two weeks before committing annually or sunsetting a vendor. Short measurement windows beat long debates. Export logs, tag them, compute the metric or variance, then decide. Data ends internal stalemates that otherwise consume more payroll than the AI line item under discussion.
The Bottom Line
Cost per ai generation only matters when tied to usable outputs and full workflow cost. Compare workflows with honest labor and retry math, then track trends across model updates. Cheapest tokens are not cheapest outcomes.