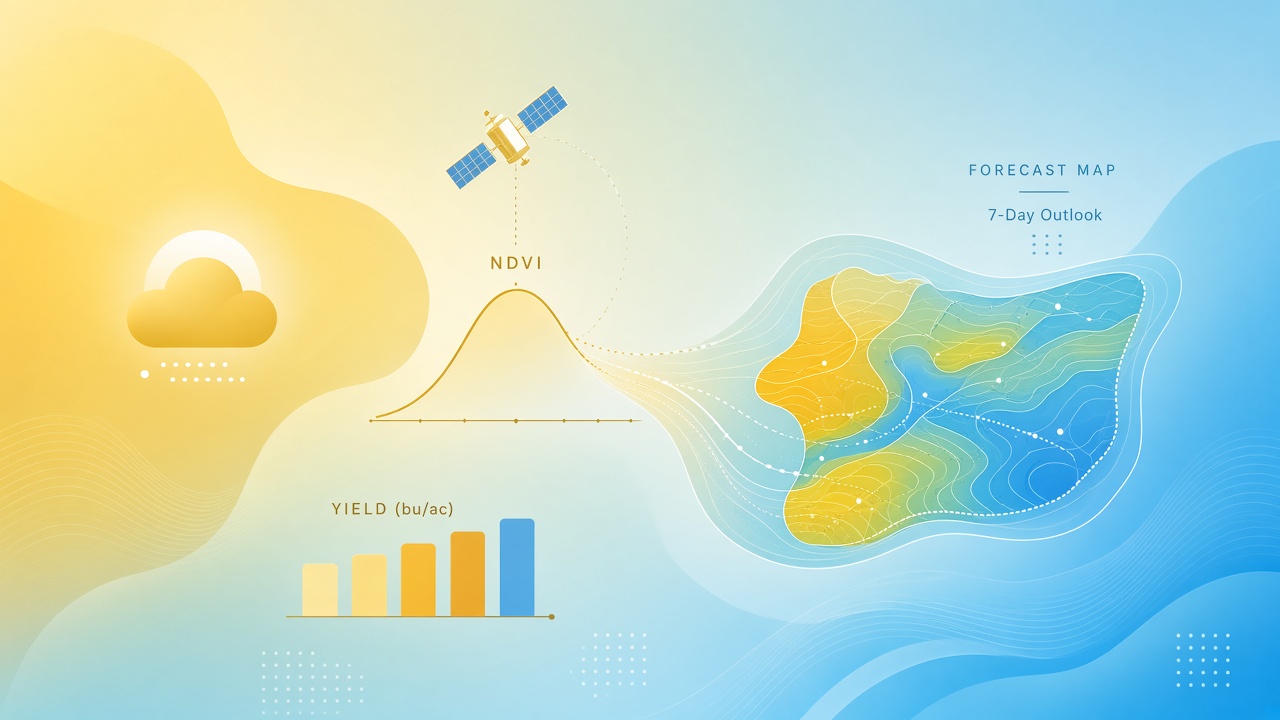
Insurers, cooperatives, and grain traders still rely on county averages while within-field yield swings drive profit. Crop yield prediction AI weather fusion merges Sentinel-2 vegetation indices, ERA5 or NASA POWER climate series, soil grids, and topography through gated or attention-based deep models. Published sub-field models reach R2 around 0.68, climbing toward 0.80 at field averages and higher on research benchmarks when phenology windows align with stress events.
Precision ag platforms and climate risk analysts should compare fusion architectures against naive NDVI-only baselines. Teams browsing AI chatbot agronomy tools need crop-specific validation, not global magic numbers. More explainers appear on the EliteAI.tools blog index.
Weather fusion matters because growing-degree-day accumulations, vapor pressure deficit during pollination, and post-flowering heat stress explain yield variance that peak NDVI cannot capture once canopies senesce. SoilGrids clay content modulates how identical rainfall translates into plant-available water. Sentinel-2 revisit cadence every five days at equator latitudes forces gap-filling algorithms that gated fusion handles better than early fusion when entire weeks of imagery disappear under cloud. Buyers comparing vendor dashboards should ask whether reported R2 used spatial cross-validation or random pixel splits that leak neighboring field correlation.
What Crop Yield Prediction AI Weather Means in Plain Language
Crop yield prediction AI weather fusion combines satellite crop development signals with historical and forecast weather time series plus static soil maps to estimate harvest tonnes per hectare before combine monitors run. Fusion matters because late-season heat waves suppress yield after green canopy peaks, a pattern NDVI alone misses.
Early fusion stacks raw modalities into one tensor; late fusion trains separate encoders then merges representations. Adaptive gated fusion learns sample-specific weights when soil moisture matters more in drought years than in wet ones.
| Modality | Yield insight | Common source |
|---|---|---|
| Optical satellite | Biomass, phenology, stress | Sentinel-2, MODIS |
| Weather time series | Heat, drought, frost during grain fill | ERA5, NASA POWER |
| Soil and terrain | Water holding, drainage heterogeneity | SoilGrids, DEM |
| Management labels | Hybrid, planting date, irrigation | Farmer records, machinery ISOBUS |
How the Underlying AI Pipeline Works
Pipelines ingest aligned rasters and tables per field polygon, encode each modality, fuse with learned weights, regress yield, and backtest with leave-one-year-out or spatial blocks to avoid optimistic scores. Google Earth Engine often hosts feature engineering; training may occur in Python with yield monitor ground truth at 10 meter pixels.
Multi-modal gated fusion (MMGF)
MMGF uses separate encoders for Sentinel-2 optical stacks and weather sequences, then a gated unit computes sample-specific fusion weights. On soybean, wheat, and rapeseed across Argentina, Uruguay, and Germany, sub-field R2 reached about 0.68 while field-level averages approached 0.80. Gates shifted weight toward weather in water-limited regions and toward optical data where canopy variability dominated, matching agronomic intuition.
Attention-based spatio-temporal models
Attn-CropNet (ABMMDLF) combines CNN spatial encoders with temporal attention over daily climate series and static soil properties, reporting R2 around 0.89 on research benchmark splits. Attention weights highlight critical phenological windows such as flowering heat stress, improving interpretability versus black-box late fusion.
CNN-LSTM county forecasts
U.S. county-level soybean models merging MODIS land surface temperature, surface reflectance histograms, and weather tensors in a CNN-LSTM architecture outperformed pure CNN or LSTM baselines for in-season and end-of-season forecasts on Google Earth Engine. County scale smooths sub-field heterogeneity but supports regional commodity planning where fine maps are unavailable. Commodity traders use county CNN-LSTM updates weekly during grain fill to adjust hedge positions, though they should treat sub-field MMGF maps as separate products with different error budgets.
ERA5, SoilGrids, and Sentinel-2 early fusion
Early fusion pipelines rasterize SoilGrids clay and organic carbon to the Sentinel-2 pixel grid, append ERA5 daily temperature and precipitation statistics per pixel-week, and stack reflectance bands into a single tensor for 3D CNN or transformer encoders. Global covariate availability lets NGOs and national food security agencies deploy fusion in data-sparse countries before yield monitor networks mature. Misregistration between 10 m satellite pixels and 250 m soil layers introduces noise; practitioners should resample soil layers with uncertainty bands and test sensitivity to grid choice. Cloud masking and Sentinel-2 gap filling remain operational bottlenecks in humid tropics where optical time series break during monsoon weeks critical for rice yield formation.
Growth-stage conditioning and process hybrids
Advanced fusion models condition weather weights on phenology stage inferred from satellite green-up dates or crop calendars. Nitrogen stress during vegetative growth and water stress during grain fill produce similar NDVI dips but imply different yield penalties. Stage-aware gating in MMGF-style architectures prevents the network from over-penalizing mid-season cloud gaps before canopy closure. Coupling neural fusion outputs with process-based crop model residuals (APSIM, DSSAT) is an active research direction for extrapolating to climate regimes underrepresented in training labels.
- Acquire yield labels from harvest monitors, plot trials, or official NASS-style statistics.
- Download ERA5 weather, SoilGrids soil layers, and Sentinel-2 composites for study years.
- Align rasters to a common projection and weekly or decadal temporal cadence.
- Train MMGF, Attn-CropNet, or CNN-LSTM with spatial and temporal cross-validation.
- Report R2, RMSE, and MAPE disaggregated by county, soil type, and drought year.
- Deploy forecasts with uncertainty intervals and agronomist override workflows.
Real Deployments and Published Evidence
Operational uptake appears in precision farming platforms and insurer pilots, though published peer review emphasizes backtests more than multi-year farmer payment outcomes. Early fusion with globally available covariates (Sentinel-2, ERA5, SoilGrids) enables scaling across regions if local yield monitors calibrate bias. MMGF gated fusion reporting R2 0.68 sub-field and 0.80 field on soybean, wheat, and rapeseed across Argentina, Uruguay, and Germany demonstrates that modality weighting helps heterogeneous parcels. Attn-CropNet R2 near 0.89 on research benchmark splits sets a high bar on specific regional datasets and should not be assumed globally portable without retraining.
Parametric crop insurance products increasingly reference fused drought indices rather than single-station rainfall triggers. National import-dependent food security agencies use county CNN-LSTM forecasts to time strategic grain purchases, though political sensitivity around forecast publication requires careful communication. Vendors should report leave-one-county-out validation and drought-year holdouts, not only average-season R2 where weather and yield correlate smoothly.
Validation protocols practitioners should demand
Prospective validation, where models trained through year N predict year N+1 before harvest weights are known, remains the gold standard few marketing decks include. Feature importance maps should show whether ERA5 temperature or Sentinel-2 NDVI drove a given forecast, helping agronomists challenge implausible predictions when pest damage dominates but vegetation still looks green from nitrogen carryover. Confusion between precision (how often high-yield predictions are correct) and explained variance (R2) misleads buyers comparing vendor dashboards.
Insurance triggers and import planning
Parametric insurance pilots fuse soil moisture deficit indices with canopy stress signals to trigger payouts before county statistics confirm disaster years. Import-dependent nations use county CNN-LSTM maize or wheat forecasts to time strategic reserve purchases, though forecast publication timing interacts with commodity market politics. Cooperatives sharing yield monitor data across members build stronger MMGF training sets than any single farm could assemble alone, improving sub-field R2 toward the 0.80 field-average benchmarks reported in peer-reviewed fusion studies.
Limits, Risks, and Ethical Guardrails
Models trained on high-input irrigated fields underpredict rainfed disaster years when transferred blindly. Missing management data (hybrid switch, fungicide) adds hidden variance. Using yield forecasts to deny credit or insurance without appeal paths raises fairness concerns. Spatial leakage from random splits inflates R2; always report geographic and temporal holdouts.
- Label leakage: Using harvest-year weather after cut-off dates inflates accuracy.
- Spatial autocorrelation: Random train-test splits overstate R2 in clustered fields.
- Soil map error: SoilGrids 250 m resolution misses drainage micro-features.
- Cloud gaps: Missing Sentinel-2 scenes bias humid-region yield estimates.
- Market manipulation: Early fused forecasts could advantage insiders if released unevenly.
Climate change introduces out-of-distribution growing seasons where historical ERA5 statistics underrepresent compound heat-drought events during flowering. Fusion models extrapolating from past decades may underestimate tail risk unless scenario weather ensembles augment neural predictions. Extension services should communicate forecast uncertainty in bushels per acre with confidence intervals, not single point estimates that farmers treat as guarantees when negotiating forward contracts.
Who Should Use This and Who Should Wait
Regional cooperatives with yield monitor history, crop insurers modeling county portfolios, and national food security agencies with satellite access should pilot MMGF or Attn-CropNet fusion now. Individual hobby farms without labeled history should wait for cooperative or extension-branded products validated locally rather than purchasing global heat maps marketed with inflated R2 from unrelated geographies.
| User | Proceed | Hold |
|---|---|---|
| Cooperative with yield monitors | Calibrate fusion models on three-plus years of fields | Buy global model without local monitor bias fix |
| Commodity trader | Use county CNN-LSTM for in-season trend signals | Treat sub-field R2 as delivery contract guarantee |
| Smallholder without monitors | Use regional forecasts for input planning only | Pay for pixel yield maps without ground truth |
| Research extension | Benchmark Attn-CropNet against ERA5-SoilGrids baselines | Report spatial CV, not random splits |
Frequently Asked Questions
Why is sub-field R2 lower than field R2?
Pixel noise, unobserved management, and registration errors increase variance at 10 meter scales; averaging to field polygons smooths error. MMGF reports about 0.68 sub-field versus 0.80 field level.
Which weather dataset should fusion use?
ERA5 reanalysis and NASA POWER appear frequently for global coverage; local station bias correction improves extreme event capture when stations exist. Match weather grid to field centroid carefully.
Is NDVI alone enough?
NDVI captures canopy vigor but misses grain fill stress after canopy senesces; weather fusion addresses that gap. Always compare against NDVI-only baselines in backtests.
Can models update mid-season?
CNN-LSTM county studies show in-season skill gains as new satellite and weather observations arrive. Retrain or fine-tune cautiously to avoid overfitting one abnormal year.
Do models transfer across crops?
Gated fusion learns different modality weights per crop and country; zero-shot transfer usually fails without local yield labels. Train separate heads or fine-tune encoders per crop.
Are AI yield maps used in insurance payouts?
Some index insurance pilots use satellite proxies; most programs still anchor on cut weights or cooperative surveys. Read policy fine print before relying on vendor forecasts for claims.
How strong is Attn-CropNet R2 near 0.89?
0.89 is a strong result on the specific crops and regions used in ABMMDLF source studies, indicating attention fusion captures most explainable variance where labels and imagery align well. Retrain and validate before applying to new continents or crops without local yield monitor calibration.
Can chatbots replace agronomists for fusion forecasts?
Chatbots can explain fusion outputs and scenario weather shocks but should not issue planting or chemical recommendations without licensed agronomist review. Ground-truth scouting still validates model stress flags when satellite greenness lags biological damage from pests or disease.
Conclusion
AI crop yield prediction with weather fusion merges ERA5 climate records, SoilGrids soil properties, and Sentinel-2 vegetation trajectories through MMGF gated fusion (R2 0.68 sub-field, 0.80 field), Attn-CropNet attention models (R2 near 0.89 on research benchmarks), and CNN-LSTM county soybean stacks. Early fusion simplifies global deployment; gated and attention fusion handles missing modalities and growth-stage heterogeneity better. Invest in yield monitor ground truth, report spatial and temporal holdouts, and treat forecasts as decision support rather than contractual oracle numbers. Fusion narrows harvest risk for cooperatives and insurers with labeled history; it does not replace ground truth weigh-ins at sale time.