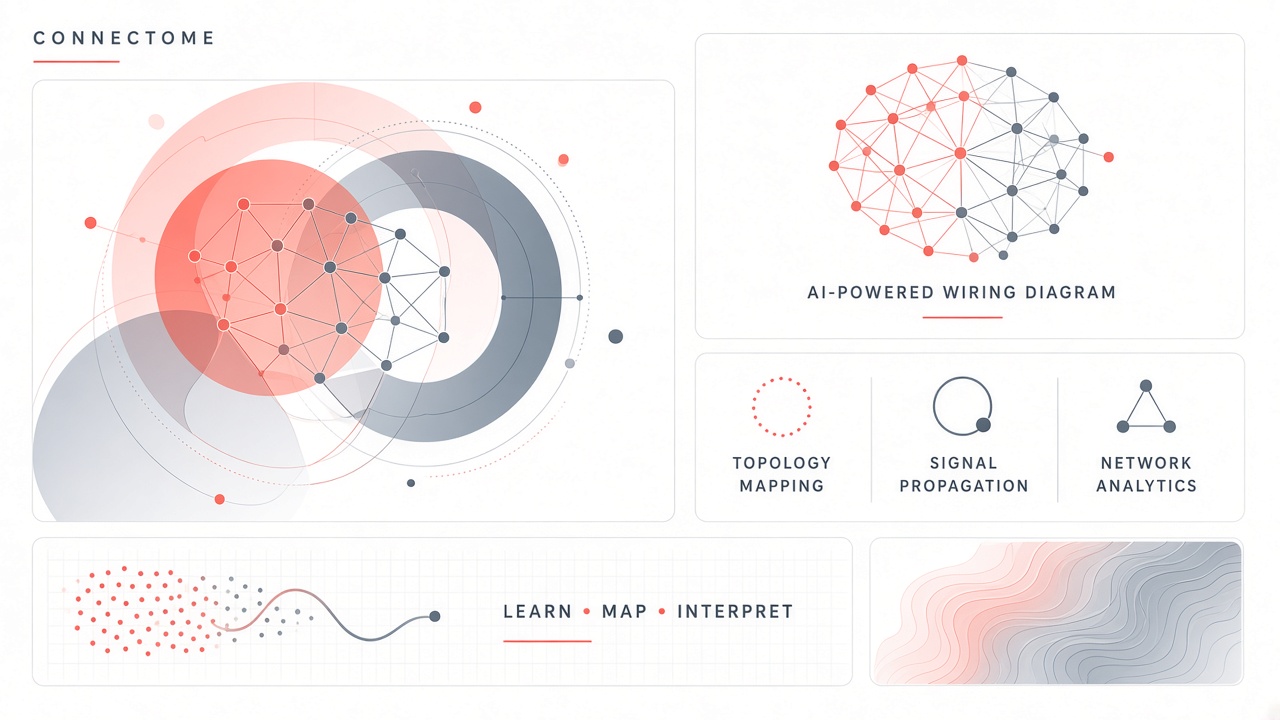
A neuroscientist wants to know which neurons in the fly brain connect a photoreceptor to a leg motor neuron. Manual tracing through electron microscopy slices would take years. AI connectome mapping automates segmentation of neurons, detection of synapses, and assembly of wiring graphs so researchers can query pathways in browsers instead of coloring cells by hand. The same machine learning stack scales from insect brains measured in micrometers to human diffusion MRI graphs that summarize white matter bundles between cortical regions. Results feed basic science, clinical imaging pipelines, and long-term brain-computer interface research discussed alongside AI chatbot copilots that summarize literature for lab teams. For broader context on how EliteAI.tools covers research topics, see the blog index.
What AI Connectome Mapping Means
A connectome is a wiring diagram: nodes are neurons or brain regions, edges are synapses or fiber tracts, and AI connectome mapping is the pipeline that builds that diagram from raw imaging data. Microscale connectomics uses electron microscopy to resolve individual synapses. Macroscale connectomics uses diffusion MRI and tractography to estimate long-range structural links between parcels defined by atlases. Both scales rely on machine learning for segmentation, alignment, classification, and quality control, but they answer different questions. Synapse-level maps explain local circuit motifs; region-level graphs support population studies linking connectivity to cognition or disease.
The term "mapping" covers acquisition, image registration, automated reconstruction, human proofreading, annotation of cell types, and public release through viewers and APIs. A finished connectome is not a single picture but a curated dataset with versioned corrections, similar to how genomics releases reference assemblies with ongoing patches.
Microscale Pipeline: EM and Segmentation
Microscale connectome projects slice brain tissue thin enough for electron microscopy, align thousands of images into a 3D volume, then run convolutional networks to segment cell boundaries and classify synapses. Alignment alone is a major challenge: serial section transmission EM and focused ion beam scanning EM produce petabyte-scale stacks where a single misregistered slice can break neuron continuity. Modern pipelines use learned aligners and consistency checks before segmentation models run.
Google Research pioneered flood-filling networks (FFNs) for this task. Instead of asking a model to classify every voxel independently, an FFN grows a neuron segment seed through the volume, stopping at learned boundaries. The approach replaced much of the manual "coloring in" work that limited early connectomics. Follow-on tools such as SegCLR assign subcellular compartments and cell types within segmented volumes. TensorStore, an open multi-dimensional array library from the same research line, helps teams store and query these massive tensors efficiently.
| Stage | Input | AI role |
|---|---|---|
| Section alignment | 2D EM slices | Learned registration, artifact detection |
| Neuron segmentation | Aligned 3D volume | Flood-filling networks, boundary CNNs |
| Synapse linking | Segment IDs + EM texture | Contact detection, confidence scoring |
| Proofreading | Draft graph | Human edits in CAVE / Neuroglancer |
| Cell typing | Morphology + connectivity | SegCLR and consortium annotations |
Proofreading and community correction
Automated segmentation still misses branches and merges separate cells. CAVE (Connectome Annotation Versioning Engine), built on Neuroglancer, lets researchers inspect 3D segments, split erroneous merges, and attach metadata. Community platforms such as FlyWire combine expert proofreading with gamified tasks so a global consortium can finish whole-brain reconstructions that no single lab could complete alone. Proofreading is not optional polish; it is part of the scientific product because downstream circuit tracing assumes graph accuracy.
Fly Connectome and Google Hemibrain
The 2024 FlyWire release mapped an entire adult fruit fly brain: about 139,000 neurons and roughly 54 million chemical synapses, annotated with more than 8,400 cell types. Published in Nature as part of a multi-paper package, the resource lets researchers trace sensorimotor pathways, compare hemispheres, and download graphs programmatically through Codex (codex.flywire.ai). It builds on earlier work including Google's 2020 "hemibrain" connectome, which covered roughly 25,000 neurons in a central fly brain volume using flood-filling networks on FIB-SEM data at 8 nm isotropic resolution.
FlyWire used a distinct imaging stack (serial section TEM at 4 x 4 x 40 nm voxels) and boundary-detecting CNNs rather than FFNs, illustrating that multiple AI architectures can succeed when paired with the right acquisition and proofreading workflow. Hundreds of papers already cite the hemibrain; the whole-brain fly map is the largest synapse-resolved connectome released to date and a template for scaling methods toward larger species.
Human Connectome Project and Macro Maps
The Human Connectome Project (HCP) provides high-quality diffusion MRI from more than 1,000 healthy young adults, enabling structural connectomes at the level of brain regions rather than individual synapses. Preprocessed HCP diffusion data supports tractography pipelines in FSL (probtrackx) and MRtrix3: estimate fiber orientation distributions, generate millions of streamlines, filter with SIFT, then map streamlines to atlas parcels to produce an N x N connectivity matrix. The HCP-MMP1.0 atlas defines about 360 cortical areas per subject using multimodal cues (myelin, thickness, resting and task fMRI), giving finer regional labels than classic Desikan-Killiany parcellations.
Macro connectomes do not list every synapse. They quantify how strongly white matter links regions, useful for comparing groups, studying development, and pairing with functional MRI networks. Large cohort efforts (UK Biobank and successors) now release connectomes for tens of thousands of participants, turning connectivity graphs into a population neuroscience resource. AI assists tractography quality control, harmonization across scanners, and denoising, but the interpretive step still requires careful atlas choice and statistical modeling.
| Resource | Scale | Primary modality |
|---|---|---|
| Google fly hemibrain (2020) | ~25k neurons, ~20M synapses | FIB-SEM + flood-filling networks |
| FlyWire whole fly (2024) | ~139k neurons, ~54M synapses | ssTEM + community proofreading |
| Google human cortex sample | ~57k cells, ~150M synapses (1 mm³) | EM + FFN + CAVE proofreading |
| Human Connectome Project | Region graphs (100 to 360+ nodes) | Diffusion MRI tractography |
Google Human Cortex Sample and Scaling Out
Google's connectomics team reported a cubic millimeter of human cortex with on the order of 57,000 cells and 150 million synapses, reconstructed with the same AI toolchain used for flies but at a vastly larger data scale. That volume is tiny relative to a whole human brain yet already pushes storage, compute, and proofreading workflows. The milestone shows FFN-based reconstruction can generalize beyond invertebrate models, but a full human synapse connectome remains a multi-decade engineering and funding challenge, not a near-term product feature.
Practical near-term wins include targeted EM volumes of disease-relevant circuits, improved automated synapse classification, and better integration between EM graphs and MRI-derived graphs for the same species. Tooling such as Neuroglancer and programmatic access APIs lower the bar for labs that will never run their own petabyte cluster but can query released graphs.
Limits, Risks, and Ethics
Connectome maps describe structure, not guaranteed function: two brains with similar graphs can behave differently because of dynamics, neuromodulators, and learning history. Tractography can report false-positive bundles; EM segmentation can merge neurons and inflate synapse counts. Overclaiming "we mapped thought" from a region-level matrix misleads the public and erodes trust in neuroscience AI.
Ethical issues intensify as maps move from flies to humans. Post-mortem tissue studies require consent and equitable participation. Clinical diffusion scans raise privacy questions when connectivity features predict mental health traits. Connectome data linked to identifiable MRI should follow the same governance as other neuroimaging cohorts. AI-assisted proofreading outsourced to crowds needs quality audits and fair compensation.
Common failure modes
- Section alignment gaps that truncate axons
- Merge errors that invent impossible mega-neurons
- Synapse detector false positives at membrane appositions without vesicles
- Tractography shortcuts through CSF or gray matter when ACT constraints are weak
- Atlas mismatch when comparing studies that used different parcellations
Who Should Use Connectome AI Now
Drosophila neuroscientists, computational neuro labs, and imaging core facilities with EM or HCP expertise should adopt released connectome AI tooling now; general clinical teams should treat synapse maps as research-only. Fly researchers can query FlyWire and hemibrain today for hypothesis generation about circuits underlying learning, sleep, and navigation. Human MRI labs can build reproducible HCP-style pipelines with open MRtrix3 tutorials. Pharmaceutical R&D exploring circuit targets may monitor EM volumes but should not base patient labeling on draft graphs.
Software teams building consumer brain apps should avoid implying personal connectome readouts from a single cheap scan. Legitimate products focus on radiologist workflows, research cohort management, or education, not deterministic personality inference. Teams evaluating AI chatbot assistants for neuro labs should require citation of dataset version, species, and atlas when summarizing connectivity claims.
Bridging Micro and Macro Connectomes
Integrating synapse-level EM graphs with MRI tractography is an active research frontier, not a shipped product feature. Teams register EM volumes to MRI space where possible, use sparse EM ground truth to train tractography priors, or compare motif statistics between species. The goal is richer models of how local wiring constraints shape long-range pathways. Buyers should treat "multiscale brain digital twin" marketing as aspirational until vendors publish reproducible pipelines on public data with independent benchmarks.
Workflow Checklist for Labs
- Define scientific question: synapse motif vs regional graph.
- Pick modality: EM volume size vs MRI tractography feasibility.
- Budget storage and GPU hours; petabyte EM is not a laptop project.
- Plan proofreading hours or consortium participation for EM.
- Register outputs with DOI-backed releases and version pins.
- Pair structural maps with functional or behavioral assays before causal claims.
Frequently Asked Questions
How does the fly connectome relate to human brain maps?
The fly connectome is synapse complete for an entire small brain and supports circuit tracing from sensory input to motor output. Human HCP-style maps summarize regional white matter connectivity across thousands of people but do not list individual synapses. Fly maps inspire algorithms; human maps support population neuroscience. Direct translation of circuit motifs requires homology arguments that rarely hold one to one.
What are flood-filling networks in connectomics?
Flood-filling networks are 3D convolutional models that grow a neuron segment from a seed voxel through EM volumes, learning when to stop at membranes. Google introduced them to automate reconstruction that previously required manual painting in every slice. They powered the fly hemibrain and human cortex sample reconstructions, often combined with human proofreading in CAVE.
Can clinicians use Human Connectome Project pipelines on patients?
Research pipelines built on HCP preprocessing are adapted in studies but are not turnkey FDA-cleared diagnostics. Clinical diffusion MRI uses different protocols and quality controls. Teams may borrow atlas parcellations and open-source tractography code while validating outcomes on local patient cohorts under IRB oversight.
How much data does a connectome require?
Whole fly EM connectomics involved imaging at nanometer resolution across an entire brain, producing datasets handled by specialized storage systems. A cubic millimeter of human cortex already implies hundreds of terabytes to petabytes depending on resolution and duplication. Macro HCP connectomes per subject are orders of magnitude smaller but still need careful preprocessing provenance.
Should labs use AI chatbots to interpret connectomes?
Chatbots help draft literature summaries and code snippets but can hallucinate pathway names or cite wrong dataset versions. Always verify claims against primary papers, FlyWire Codex, or released HCP derivatives. Treat chat output as a draft indexed to DOIs, not as ground truth wiring.
When will a whole human synapse connectome arrive?
No credible timeline exists for a complete human synapse map at fly resolution. Current roadmaps focus on larger EM volumes, better automation, and combining macro MRI graphs with sparse EM ground truth. Progress is real but incremental; beware vendors promising whole-brain synapse maps on consumer hardware.
Conclusion
AI connectome mapping turns imaging stacks into queryable wiring diagrams, from FlyWire's whole fly brain and Google's flood-filling network reconstructions to Human Connectome Project tractography graphs. The field splits microscale synapse cartography and macroscale regional connectivity, each with distinct AI pipelines, proofreading burdens, and scientific uses. Adopt released fly and HCP resources for research today; treat clinical synapse mapping and sensational mind-reading claims with skepticism until validation catches up. Explore related explainers on the blog index.