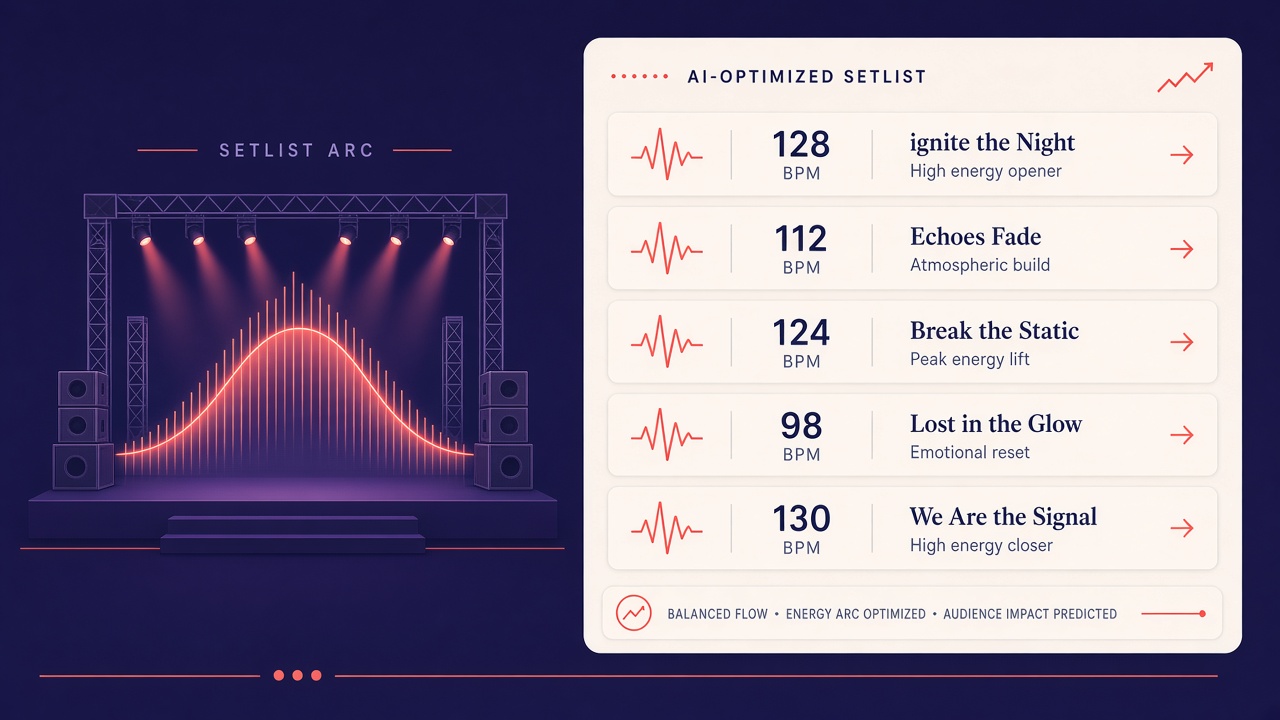
AI concert setlist optimization uses streaming analytics, prior show data, and venue demographics to order songs into energy arcs that keep audiences engaged, though fans and artists push back when tours feel too predictable or algorithmically safe. Platforms like BandMGT AI Setlist Coach, Setlist Architect, and Band Buddy score BPM, key, and crowd-response history to suggest openers, peaks, and encore material. City-level Spotify listener maps and tools such as Sprinter help routing and capacity decisions, which indirectly shape which deep cuts travel to which markets. The goal is narrative flow, not a spreadsheet read aloud on stage. Readers exploring AI chatbot assistants for creative workflows or browsing popular AI tools should treat setlist AI as decision support, not a replacement for room feel.
The Setlist as Narrative Arc
A strong live set behaves like a story: an opening statement, rising tension, a breather, a second climb, and a memorable close, with tempo and key changes that feel intentional rather than random. Veteran tour managers describe this as an energy curve. Ballads placed after three uptempo tracks give lungs and ears a rest. A mid-set surprise deep cut rewards loyal fans without losing casual listeners who came for the single. Encores are not afterthoughts; they are the emotional payoff the entire arc was building toward.
Before machine learning, artists relied on memory, road diaries, and soundcheck experiments. Setlist.fm archives now give public historians and data teams millions of documented shows to study. When AI tools ingest BPM, musical key, duration, and subjective energy ratings per song, they optimize transitions the way a DJ might: smooth tempo steps, compatible keys, and cumulative runtime that fits festival slots or club headliners.
Data Sources: Streaming, Prior Shows, and Locale
Modern setlist AI pulls from digital service provider charts, historical setlist databases, ticket sell-through by city, and optional performance notes logged after each gig. BandMGT Pro layers venue intelligence and show history so the coach knows which songs died in a particular room versus which ones triggered singalongs. Setlist Architect and similar planners accept manual BPM and energy inputs, then visualize the arc as you drag songs. Band Buddy targets working cover bands, matching vocal range and instrumentation to demographic profiles supplied for weddings, corporate events, or bar residencies.
Streaming data answers a different question: which tracks listeners in Dallas stream disproportionately compared to Portland? Artists on arena tours sometimes rotate regional favorites. Data can justify a deep cut where local superfans cluster, or warn against leaning on a album track that never charted in that market. The risk is overfitting to streams that reflect playlist algorithms, not mosh-pit energy.
| Data source | Setlist use | Limitation |
|---|---|---|
| DSP city charts | Regional deep cuts, encore candidates | Passive listening differs from live demand |
| Setlist.fm archives | Tour patterns, rarity scoring | Incomplete for club and festival sets |
| Post-show notes | Venue-specific hit and miss memory | Requires disciplined logging |
| Audio feature APIs | BPM, key, danceability metadata | Studio tempo may differ from live arrangements |
Energy Curve Optimization
Energy curve optimization ranks songs by subjective intensity, tempo, and harmonic compatibility, then arranges them so no more than two or three consecutive tracks sit at the same energy band without a deliberate valley or spike. Setlist Architect explicitly models build-up, peak, breather, second build, and finale. BandMGT AI Coach outputs an overall score, flags risky runs, and proposes one-tap swaps from the library. Pinning an opener or closer is standard: algorithms optimize the middle while respecting fixed anchors.
Festival sets compress the arc into 45 to 60 minutes. Club headliners stretch to 90 minutes with a formal encore block. Support acts need tight 30-minute stories with no dead air. AI planners that show total duration and cumulative BPM drift help production managers hit hard curfews without sacrificing the big finish.
Fan Desire for Surprises
Concertgoers want recognition and novelty at the same time: they expect the hits, but they treasure the rare B-side or cover that proves the artist was listening to that city. When every night follows an identical optimized order, social media deflates the urgency to attend multiple dates on a tour. Phish, Bruce Springsteen, and Beyoncé built reputations partly on setlist variance. Data tools work best when they reserve slots for chaos: a guest appearance, a debut, or a request moment the model did not schedule.
Some artists publish nightly setlists within minutes of the final bow, which feeds fan databases and paradoxically makes repetition more visible. Transparency rewards variation. A practical compromise is tiered templates: a core spine of hits with two or three rotation positions filled by locale scores or dice rolls the day of show.
Artist Pushback on Formulaic Tours
Musicians resist when managers treat optimization output as mandatory, especially when it sidelines new material or experimental arrangements that streaming data has not validated yet. Creative directors argue that albums are launched on tour, not only promoted. A song that charts poorly on release week might become a live centerpiece once audiences hear it in context. AI that only maximizes past performance can starve future catalogs.
Ethical deployment keeps the artist or musical director as final approver. Coaches should explain why a swap is suggested, not hide scoring behind a black box. Teams already using AI chatbot tools for lyrics or staging notes can extend the same human-in-the-loop pattern to setlists: generate three options, debate in rehearsal, log the outcome.
Streaming Popularity vs Live Demand
Streaming charts measure passive listening on headphones; live demand measures whether a chorus can carry a stadium when the band is three songs deep and the PA is loud. A track that dominates playlists may still flop as a singalong if the melody sits in a register the crowd cannot reach. Conversely, cult album cuts with moderate stream counts can detonate in person when the fan base skews toward concert regulars who memorized B-sides years ago. Setlist AI should weight multiple signals: skip rate on live recordings uploaded to fan archives, merch table sell-through tied to specific song mentions, and social sentiment in the 24 hours after a show.
Label marketing teams sometimes push new singles into every set regardless of room readiness. Data gives the musical director evidence to delay a song until audiences have heard it on radio or TikTok sound trends peak in that metro. The conversation shifts from taste arguments to testable hypotheses: we played track X in three markets with lukewarm response; hold it until the album cycle hits week six in this time zone.
Festival vs Theater Constraints
Festival slots punish slow builds: you have one chance to prove identity before the next act loads in. Theater residencies reward patience and narrative depth across 20-plus songs. Optimizers need venue templates. Outdoor festivals may require wind-safe arrangements and shorter instrumental intros. Theaters with seated audiences tolerate longer storytelling between songs. AI that ignores production constraints suggests transitions the backline cannot execute, such as guitar changes every 90 seconds when only two techs work the wing.
Hard curfews at urban amphitheaters mean the energy arc must compress. A breather ballad at minute 55 becomes impossible when load-out starts at minute 75 including encore. Duration-aware planners prevent the classic mistake of stacking three mid-tempo album tracks where a single uptempo rally belongs.
Workflow for Touring Teams
A workable pipeline imports the master song list with live BPM and keys, attaches venue and market tags to each calendar date, runs the optimizer, then holds a 30-minute production meeting to override anything that feels wrong.
- Normalize metadata for every playable song, including alternate arrangements.
- Tag each show with capacity, indoor or outdoor, festival or theater, and curfew.
- Generate a baseline set and export PDF or shareable cards for stage and backline.
- After the gig, log crowd response and technical issues tied to specific songs.
- Retrain recommendations before the next leg using those notes, not only streams.
Tour routing platforms like Sprinter sit upstream: they predict ticket demand by city and suggest venue sizes. Setlist optimization sits downstream: given you are playing Cleveland on a Tuesday, which twelve songs earn that drive? Connecting both layers avoids booking a room too large for local streams while still underplaying a deep catalog gem the data says Cleveland loves.
Rehearsal is where data meets muscle memory. Musicians should run the optimized order at soundcheck volume, not only on paper, because key changes and tempo adjustments that look fine in a spreadsheet may fatigue vocalists when stacked back to back. Document which swaps required transposed arrangements so the next tour leg does not rediscover the same friction.
Merchandise teams care about setlists too: deep cuts that surprise Reddit threads can spike shirt sales if the lyric is printed on tour exclusives. Conversely, playing a rarity without warning may confuse casual buyers who only know the radio single. Share the planned arc with merch booths so they stock the right designs night to night.
Frequently Asked Questions
How does AI handle festival sets with strict time limits?
Festival mode caps total runtime and often forbids long tunings between songs, so optimizers prioritize impact density over gradual builds. Open with a recognisable hook, stack two mid-tempo winners, peak before minute 40, and land a single encore-quality track if the schedule allows no formal encore walk-off.
Should encores be algorithmically planned?
Plan encore candidates in advance but keep the trigger human: the artist reads the room before reappearing. Data can rank which songs historically spike merch and streaming after shows, useful for choosing between two strong closers.
Do legacy acts benefit from setlist AI?
Legacy acts with decades of material gain the most from rarity scoring and fatigue analysis, because the combinatorial space is enormous. The danger is nostalgic autopilot. Use data to rotate deep cuts, not to freeze a greatest-hits museum piece every night.
Can the same tools serve DJs and bands?
DJ setlist tools emphasize harmonic mixing and BPM tolerance; band tools emphasize vocal stamina and stage change logistics. Shared math includes energy arcs and transition smoothness, but the constraints differ enough that products rarely serve both equally well.
Does setlist optimization share listener data publicly?
Reputable tour tools aggregate anonymized streaming and ticket trends; they should not expose individual fan identities to venues. Review vendor privacy policies before connecting label analytics accounts.
How do cover bands use setlist AI differently?
Cover bands optimize for vocal range fit, client demographics, and medley legality rather than album cycle promotion. Band Buddy-style planners match songs to available musicians and flag crowd singalong anthems for wedding versus corporate gigs.
What post-show metrics improve the next city?
Log decibel crowd response, social mentions per song, bar sales during ballads, and exit timing during deep cuts. Qualitative notes from the front-of-house manager often beat raw stream counts for the next night's swap decisions.