Top AI tools for Data Visualization
-
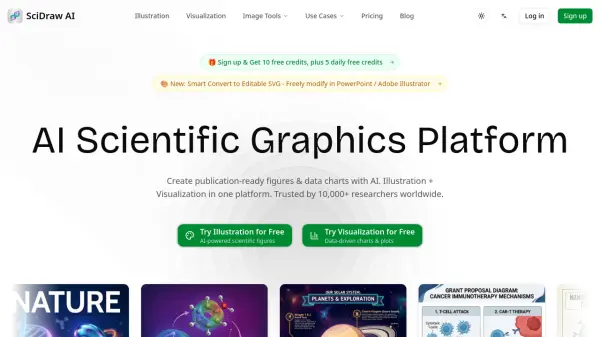 SciDraw AI Publication-Ready Scientific Figures & Charts, Powered by AI
SciDraw AI is an AI-powered scientific graphics platform that enables researchers to create publication-ready illustrations, data charts, and scientific figures in minutes. Trusted by 10,000+ researchers worldwide, it combines AI illustration and data visualization in one streamlined platform.
- Freemium
- From 10$
-
 Aceyus Contact center analytics and omnichannel reporting platform
Aceyus provides a real-time dashboard, Aceyus VUE, to centralize contact center metrics, offering call center analytics, omnichannel reporting, and customer journey insights for better decision-making.
- Contact for Pricing
-
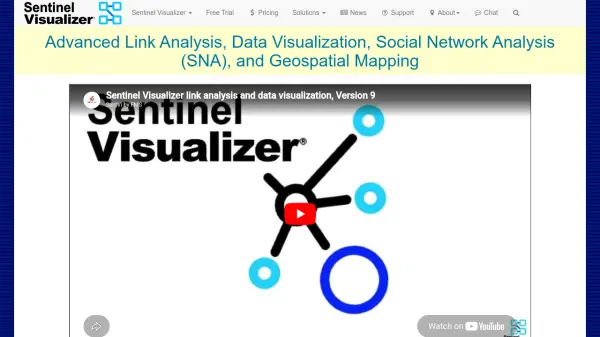 Sentinel Visualizer Advanced Link Analysis and Data Visualization
Sentinel Visualizer is a powerful tool for link analysis, social network analysis, and geospatial mapping, enabling users to discover hidden relationships among people, places, and events.
- Contact for Pricing
-
 SoftArk Custom Software & AI Agents for Your Business
SoftArk is a Rotterdam-based software and AI agency that builds custom software and AI agents to automate business processes, trusted by leading companies with ISO 27001 and GDPR compliance.
- Contact for Pricing
-
 Tecplot CFD Visualization and Analysis Software
Tecplot provides advanced post-processing tools for CFD, simulation, and experimental data visualization and analysis. It helps engineers and scientists discover, analyze, and communicate results with high-quality images and outputs.
- Contact for Pricing
-
 Pulsar Platform Audience Intelligence Platform for Social Listening and Trend Analysis
Pulsar is an audience intelligence platform that helps brands understand fragmented audiences through social listening, trend analysis, and narrative detection, enabling tailored marketing and communications strategies.
- Contact for Pricing
-
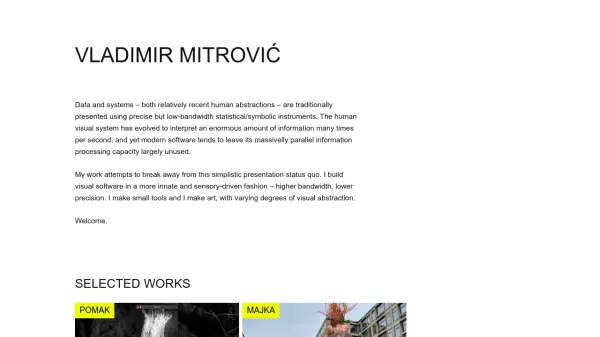 Brutalism.rs Visual software with higher bandwidth, lower precision
Brutalism.rs is a collection of experimental visual software and generative art by Vladimir Mitrović, leveraging the human visual system's massive parallel processing capacity through sensory-driven, low-precision design.
- Free
-
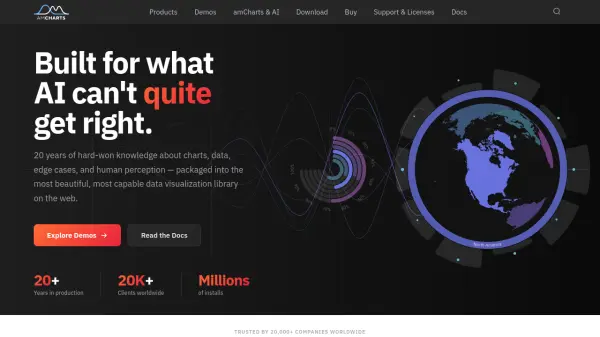 amCharts The most beautiful, most capable data visualization library on the web.
amCharts is a powerful data visualization library offering 60+ chart types, interactive maps, stock charts, and Gantt charts with AI-friendly tools, built-in accessibility, and flexible licensing options.
- Freemium
-
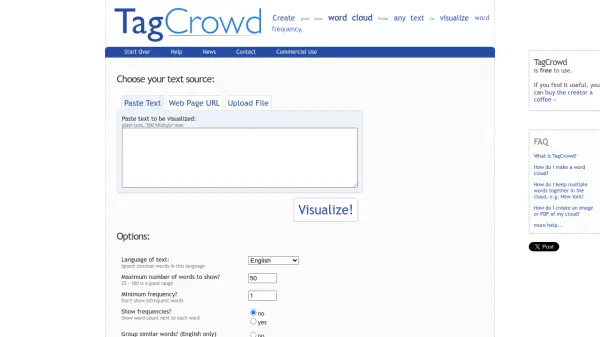 TagCrowd Create beautiful word clouds from any text
TagCrowd is a free online tool that generates word clouds from text to visualize word frequency.
- Free
Explore More Tags
-
compliance tools 77 tools
-
GDPR 57 tools
-
legal research 48 tools
-
productivity 237 tools
-
document interaction 31 tools
-
content analysis 117 tools
-
audio transcription 72 tools
-
video transcription 81 tools
-
meeting minutes 20 tools
Didn't find tool you were looking for?