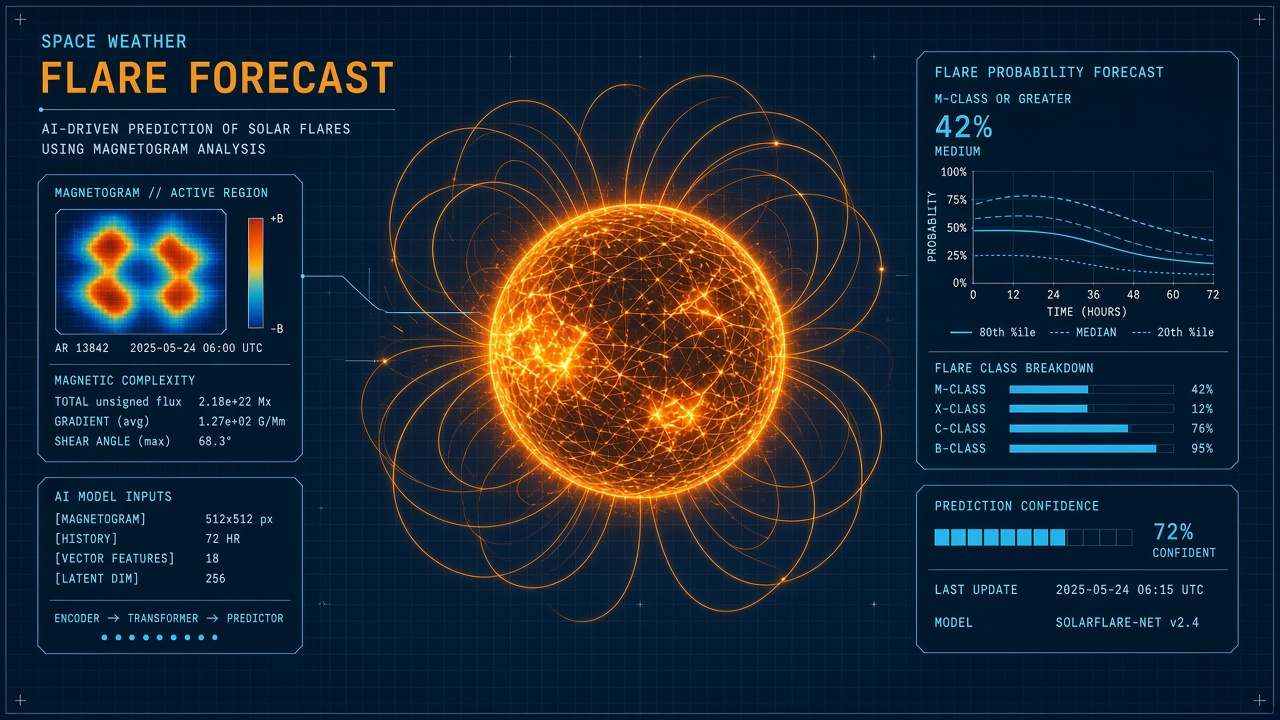
A single X-class solar flare can degrade GPS accuracy, trip power-grid relays, and force astronauts into radiation shelters within minutes of peak emission. Forecasters cannot wait for the flare itself: they need probability estimates hours ahead from evolving magnetic fields on the Sun. Machine learning on magnetogram time series from the Solar Dynamics Observatory Helioseismic and Magnetic Imager (SDO/HMI) now competes with physics-based models on benchmark tasks. Multivariate Vision Transformer (MViT) architectures report true skill scores near 0.707 on flare classification, iTransformer variants reach about 0.768, and recent multimodal models combining magnetograms with EUV imagery approach 0.86 true skill for C5-class flares within a two-hour horizon on SuryaBench and FlareBench datasets. NASA Community Coordinated Modeling Center (CCMC) comparisons help operational centers decide when neural forecasts add value over empirical rules. Readers exploring AI research for space weather or popular AI tools for time-series forecasting should understand what protects infrastructure before headlines about geomagnetic storms arrive.
Space Weather Impacts on Infrastructure
Solar flares and coronal mass ejections disturb Earth's magnetosphere, ionosphere, and upper atmosphere, with effects that cascade into GPS navigation, aviation communications, satellite operations, and high-voltage power grids. X-class flares emit intense X-ray and extreme ultraviolet radiation that ionizes the dayside ionosphere within minutes, causing radio blackouts on sunlit Earth and degrading single-frequency GPS receivers. Coronal mass ejections arrive hours to days later, driving geomagnetic storms that induce geomagnetically induced currents in long transmission lines. Transformers can overheat; protective relays may trip regionally. Polar routes for aviation face higher radiation dose for crews and passengers. Low Earth orbit satellites drag faster during expanded thermosphere heating and may need earlier reboost burns.
Astronauts on the International Space Station monitor NOAA space weather scales and retreat to shielded modules when proton flux rises. Starlink and other megaconstellations must plan attitude changes and command uplinks around storm intervals when atmospheric drag and charging anomalies rise. The economic stakes justify investment in better flare timing: a well-timed satellite safe mode or grid operator advisory can avoid asset damage worth far more than model development cost. AI solar flare prediction does not replace human forecasters; it extends lead time when magnetogram patterns encode stress before visible eruption.
| Impact domain | Typical trigger | Lead time AI may add |
|---|---|---|
| GPS and GNSS | Ionospheric scintillation, D-region absorption | Minutes to hours for flare-driven effects |
| Power grids | Geomagnetic storms after CME arrival | Flare alerts precede CME forecasts |
| Satellite ops | Charging, drag, comms blackout | Hours if active region evolution is captured |
| Human spaceflight | Radiation belt enhancement | Hours for flare-associated proton events |
Solar Observation Data Streams
Operational flare AI pipelines ingest near-real-time magnetograms, multiwavelength EUV images, soft X-ray flux curves, and metadata on active region size and magnetic complexity. SDO/HMI delivers full-disk line-of-sight and vector magnetograms every few minutes at roughly 1 arcsecond spatial sampling, the workhorse input for sequence models. Complementary Atmospheric Imaging Assembly (AIA) channels at 94, 131, 171, and 304 angstroms reveal coronal loops and emerging flux. GOES X-ray sensors provide the ground-truth flare class labels (C, M, X) used in supervised training. Ground-based GONG and SOLIS magnetograms extend coverage when SDO is in eclipse season, though resolution differs.
Benchmark datasets standardize these streams for reproducible comparison. SuryaBench and FlareBench package labeled magnetogram sequences with event times, active region identifiers, and held-out temporal splits so models cannot cheat by memorizing solar cycle phase. Researchers align inputs to fixed cadence (often 12 minutes matching HMI availability), crop active region patches, and normalize magnetic field units. Missing frames from telemetry gaps require interpolation or masking strategies that affect reported skill. Multimodal models fuse EUV tensors with magnetogram stacks so rising coronal brightness contributes alongside magnetic shear metrics.
Sequence Models on Magnetograms
Convolutional encoders, Vision Transformers, and inverted Transformer blocks treat magnetogram time series as spatiotemporal tensors, learning patterns of emerging flux, polarity inversion lines, and magnetic shear that precede eruption. MViT architectures adapted to solar physics report true skill scores around 0.707 on multi-class flare forecasting tasks in peer-reviewed benchmarks, beating simpler recurrent baselines when long-range spatial context matters. iTransformer variants, which apply attention across variate channels rather than time steps first, reach approximately 0.768 true skill by better modeling cross-band relationships between magnetic components. These numbers are dataset-specific; FlareBench leaderboard entries shift as new architectures publish.
Physics-informed features still help: total unsigned magnetic flux, length of strong-gradient polarity inversion lines, and proxy measures of magnetic helicity injection are often concatenated to learned embeddings. Some teams pretrain on unlabeled magnetogram sequences with masked patch prediction, then fine-tune on flare labels, mimicking language-model pretraining for the Sun. Class imbalance is severe: X-class events are rare, so training uses weighted loss, focal loss, or oversampling of active region epochs near historical eruptions. Geographic holdout by active region ID prevents the model from recognizing a familiar sunspot group rather than generalizing magnetic topology.
Probability Forecasts and Lead Times
Modern systems output calibrated probabilities for flare class thresholds (for example C5, M1, X1) at horizons from 24 hours down to 2 hours, with lead time traded against precision. Recent multimodal models report true skill near 0.86 for C5 flares within a two-hour window when EUV and magnetogram channels are fused, a meaningful gain for satellite operators deciding whether to delay a maneuver. Longer horizons (24 to 48 hours) remain noisier: active regions can evolve slowly then erupt abruptly. Forecasters present reliability diagrams and Brier scores alongside headline skill so users know whether a 70 percent probability is well calibrated or overconfident.
Operational use requires explicit decision thresholds. A power grid coordinator may act only above 40 percent M-class probability at 6 hours, while a science mission might log all outputs for archive. Ensemble approaches average multiple architectures or bootstrap magnetogram noise to widen uncertainty bands. When probabilities disagree with human forecaster intuition, physics-based magnetohydrodynamic simulations from NASA CCMC can provide a second opinion, though MHD runs are slower than neural inference on GPUs.
Operational Centers Using ML
NOAA Space Weather Prediction Center, NASA CCMC, ESA space weather services, and research observatories evaluate machine learning forecasts alongside rule-based McIntosh and Mount Wilson classifications before any model influences public alerts. CCMC hosts model comparison campaigns where neural flare predictors ingest the same real-time SDO feed as physics models, with skill tracked on rolling validation windows. Transition from research to operations demands latency under a few minutes per full-disk inference, robust handling of SDO outages, and documented failure modes when new active regions rotate onto the disk without historical context in training data.
International collaboration shares weights and preprocessing code through open repositories tied to FlareBench, reducing duplicate effort. Still, forecasters emphasize that AI solar flare prediction supplements, not replaces, human duty officers who integrate coronagraph CME imagery, radio burst monitors, and heliospheric models. Regulatory frameworks for aviation and grid operators reference NOAA scales, so ML products must map cleanly to existing alert levels. Teams publishing in AI research venues increasingly release uncertainty-aware outputs and ablation studies showing which magnetogram channels drive predictions, building trust for adoption.
Active region tracking begins when a sunspot group rotates onto the visible disk. Forecasters assign NOAA numbers and monitor magnetic complexity indices derived from magnetograms. Emerging flux regions can develop into delta sunspots where opposite polarities squeeze together, a classic precursor morphology in both human rules and neural networks. When a region rotates off the west limb, models lose direct magnetogram visibility but may still infer risk from far-side seismic proxies, a weaker signal. Rotation timing matters for astronauts planning extravehicular activity: a flare during an EVA exposes crew to elevated dose if proton events follow.
Multimodal architectures align magnetogram tensors with AIA EUV movies so rising coronal loops contribute evidence before line-of-sight magnetic gradients peak. Reported true skill near 0.86 for C5 flares at two-hour horizons reflects this fusion, not magnetograms alone. Training on SuryaBench encourages fair comparison because all entrants share preprocessing and label definitions. FlareBench complements with alternative splits stressing long-tailed X-class rarity. Neither benchmark replaces operational validation at NOAA, where false alarms erode trust and missed X-class events endanger assets.
Coronal mass ejections remain a separate forecasting problem: a flare may occur without an Earth-directed CME, and quiet-looking regions sometimes launch fast CMEs with little warning. Flare AI still adds value by sequencing radiation and radio blackout risk ahead of geomagnetic storm watches. Grid operators coordinate with NOAA G-scale alerts driven by magnetometer data, while aviation receives polar cap absorption forecasts. Satellite operators upload command scripts during quiet periods so safe modes execute quickly when probabilities cross thresholds.
Frequently Asked Questions
Will a flare forecast guarantee aurora visibility?
No. Auroras depend on coronal mass ejection geoeffectiveness, solar wind speed, and local cloud cover, not flares alone. A strong flare without an Earth-directed CME may produce little aurora at mid-latitudes. Flare AI helps timing of radiation and radio impacts more than aurora tourism planning.
Does Starlink shut down during flares?
Operators rarely shut down entire constellations. They may delay attitude maneuvers, reduce uplink duty cycles, or monitor increased atmospheric drag after geomagnetic storms. Flare-driven ionospheric absorption affects ground-to-satellite links on the dayside within minutes of X-class events.
Can flare AI prevent power blackouts?
Flare alerts give early warning of radio blackouts and can precede CME-driven storm watches. Grid blackouts from geomagnetic induced currents depend on storm intensity and local grid configuration. Operators use integrated NOAA products; flare ML adds lead time for preparatory steps such as redistributing load, not a guaranteed blackout prevention switch.
What is true skill score in flare benchmarks?
True skill score (TSS) measures classifier performance on imbalanced flare labels, equivalent to recall plus specificity minus one. It ranges from negative one to one, with zero indicating no skill over random guessing. Compare TSS only within the same dataset and horizon definition.
Which data source matters most?
SDO/HMI magnetograms are the dominant input in published benchmarks. Adding AIA EUV channels improves short-horizon C-class predictions in multimodal studies. GOES X-ray curves provide labels, not usually model inputs at forecast issuance time.
How far ahead can models forecast?
Useful probabilistic signal often appears 2 to 24 hours ahead for active regions already on disk, with best short-horizon skill near 2 hours for C5 thresholds in recent multimodal work. Beyond 48 hours, emergence of new flux dominates error.
SuryaBench and FlareBench give the community shared splits so MViT, iTransformer, and multimodal entrants report comparable TSS values rather than inflated accuracy on easy subsets. When evaluating vendor claims, ask for horizon, flare class threshold, and active region holdout policy. NASA CCMC comparison runs help separate incremental benchmark gains from operational readiness on live SDO telemetry with real latency budgets.
Space weather scales used by aviation and emergency managers remain anchored to NOAA products derived from decades of observatory experience. Machine learning flare probability streams are most valuable when embedded in those existing workflows with clear escalation paths, not as standalone apps disconnected from coronagraph CME analysis and geomagnetic storm forecasting chains that follow days after the initial flare alert.