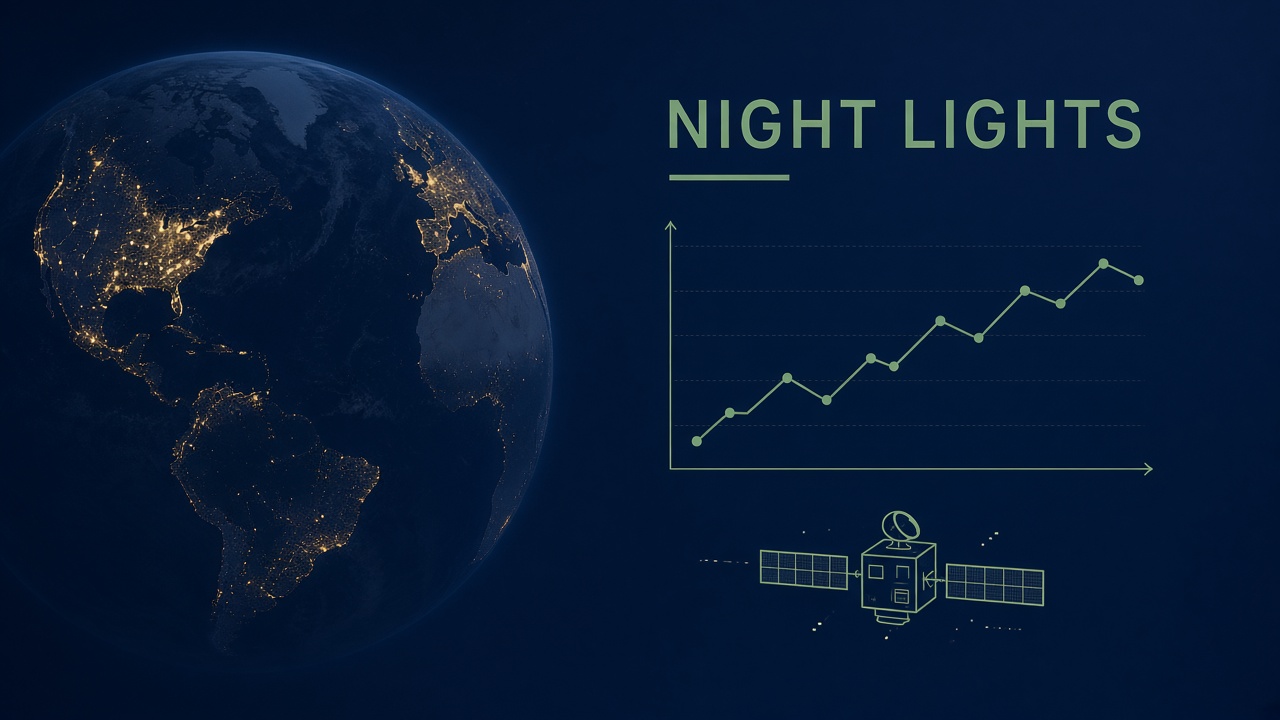
Economists have long used satellite luminosity as a proxy for economic activity when official statistics arrive late, are unreliable, or do not exist at fine spatial scales. The Visible Infrared Imaging Radiometer Suite (VIIRS) Day/Night Band on Suomi NPP and NOAA-20 captures moonlight-adjusted nighttime lights at roughly 750-meter resolution, updated nightly. Machine learning now fuses those radiance time series with mobility, search trends, and social signals to track power outages, conflict zones, and informal settlement growth in near real time. The Warcast Index, developed during the 2022 Ukraine invasion, combined NASA Black Marble VIIRS composites with Google Trends and Twitter volume to estimate localized economic disruption weeks before conventional reports stabilized. Readers exploring AI research for geospatial economics or popular AI tools for remote sensing should understand how luminosity models validate against GDP, where they fail, and why cloud-free coverage bands matter before treating night lights maps as ground truth.
What Night Lights Reveal About Economies
Nighttime radiance correlates with electrification, urban density, industrial output, and consumption patterns because artificial lighting follows human and economic activity after sunset. Henderson, Storeygard, and Weil established foundational relationships between luminosity growth and GDP growth at the country level. Modern VIIRS products correct for lunar illumination, stray light, and transient fires, producing stable annual and monthly composites suitable for panel regressions. Economists calibrate luminosity elasticities against national accounts, then apply coefficients to regions lacking surveys. The approach excels where censuses are sparse but electricity penetration is meaningful; it weakens where informal economies operate without lighting or where conflict destroys infrastructure without reducing reported activity in capital cities.
Spatial resolution near 750 meters enables city-block and peri-urban analysis. Informal economy edges often appear as gradual luminosity diffusion beyond formal zoning boundaries, detectable before land-use maps update. Random forest and gradient boosting models trained on historical lights plus covariates can forecast short-run GDP shocks, but authors caution that tree ensembles overfit local idiosyncrasies unless validated on held-out countries and years. Cross-validation across regions with different electrification baselines remains essential.
VIIRS Black Marble and Cloud-Free Coverage
NASA's Black Marble product line delivers gap-filled, moonlight-corrected nighttime lights with quality flags that analysts filter before machine learning pipelines ingest pixels. The cf_cvg (cloud-free coverage) band records how many cloud-free observations contributed to each composite pixel during a period. Low cf_cvg values indicate unreliable radiance estimates where persistent cloud, snow, or aerosols blocked views. Pipelines typically mask pixels below a coverage threshold before computing trends or training classifiers. Without that step, apparent dimming may reflect missing data rather than economic contraction.
| Data layer | Role in AI night lights economy models | Typical pitfall |
|---|---|---|
| VIIRS DNB radiance | Primary luminosity signal for GDP proxies | Blooming from bright sources bleeds into neighbors |
| cf_cvg band | Masks low-confidence pixels before ML training | Treating gap-filled areas as observed truth |
| Google Trends | Demand-side shock indicator in fusion indices | Sample bias toward connected populations |
| Social media volume | Conflict and outage narrative confirmation | Platform outages and censorship distort signals |
Warcast Index and Ukraine 2022
During the 2022 invasion of Ukraine, researchers combined VIIRS Black Marble anomalies with Google Trends and Twitter activity to produce the Warcast Index, a high-frequency indicator of localized economic stress. The fusion design addressed a core limitation: lights alone cannot distinguish deliberate blackouts from bombing damage, curfew-driven shutdowns, or frontline fires that increase transient brightness. Search interest in fuel, cash withdrawals, and migration spiked in provinces experiencing radiance drops, helping classify dimming events. Random forest models trained on pre-war relationships between lights and auxiliary signals flagged oblasts diverging from expected patterns within days of military advances.
Ukraine-specific limitations remain instructive for any conflict application. Nationwide curfews reduced lighting without proportional GDP collapse in secured cities. Artillery fires and industrial explosions created bright flashes misread as economic activity. Grid sabotage produced sharp provincial drops that lagged official statistics because national accounts aggregated surviving regions. Analysts publishing ai night lights satellite economy dashboards during crises should annotate military events, energy policy changes, and seasonal agricultural burning separately from structural economic trends.
Machine Learning Cautions for Luminosity Forecasting
Tree-based ensembles and neural temporal models can improve short-run GDP nowcasts from lights, but they require geographic cross-validation and explicit uncertainty reporting to avoid overconfident crisis narratives. Random forests capture nonlinear interactions between radiance, population density, and weather, yet they memorize country-specific electrification histories unless training folds exclude entire nations. Deep learning on image tiles treats each city as a spatial field, enabling detection of within-city reconfiguration such as port shutdowns versus residential stability. Published studies emphasize elastic net and ridge baselines; sophisticated models must beat simple lights-to-GDP regressions out of sample to justify deployment.
Informal economy edges challenge classifiers trained on formal sector relationships. Street markets with minimal lighting contribute economic value invisible to VIIRS. Conversely, brightly lit logistics yards may reflect transshipment rather than local production. Combining lights with daytime land cover, building footprints from open building datasets, and nighttime vehicle traffic where available reduces false interpretation. Policy users should treat outputs as complementary indicators reviewed by regional economists, not autonomous sanctions or aid triggers.
Validating Lights Against GDP and Ground Surveys
Validation pipelines regress log luminosity changes on official GDP growth, consumption surveys, and electrification records, reporting R-squared and root mean square error by income group and urbanization level. High-income countries with saturated lighting show diminishing marginal signal; adjustments for energy-efficient LED transitions prevent mistaking technology upgrades for recession. Low-income rural regions with rising solar home systems may brighten without matching national accounts if statistics undercount off-grid productivity. Multi-year panels with fixed effects for administrative units remain the standard academic approach before operational agencies adopt models.
Power outage detection offers a clearer validation target than GDP: utility reports and social media geotags confirm grid failures when radiance drops exceed cloud-masked noise thresholds. Conflict zone monitoring similarly compares lights trajectories with ACLED event databases and UN damage assessments. When validation targets are observable, machine learning adds value faster than for subtle informal growth at urban fringes, where ground truth is inherently sparse. Transparency about cf_cvg masking, lunar correction versions, and Black Marble product vintages lets downstream users reproduce indices like Warcast for new crises.
Power Outages and Conflict Monitoring
Utility-scale blackout detection remains one of the clearest operational wins for VIIRS machine learning because radiance drops are large, spatially contiguous, and verifiable against independent outage maps. Hurricane response teams fuse nightly DNB composites with weather tracks to prioritize grid restoration crews. In conflict settings, sustained provincial dimming often precedes formal damage assessments reaching humanitarian coordinators. Algorithms flag anomalies only after cf_cvg masking and lunar correction to avoid false alarms from cloud artifacts. Social media geolocation provides secondary confirmation when radiance falls coincide with reports of shelling or infrastructure strikes, as the Warcast Index demonstrated for Ukrainian oblasts in 2022.
Short-lived dimming from rolling blackouts differs from structural economic decline. Time-series classifiers trained on labeled outage events learn recovery slopes: intentional load shedding often shows periodic partial restoration, whereas bombing damage produces sharper declines with slower rebound. Random forest models must include these event type labels rather than treating all negative slopes as GDP contractions. Human analysts annotate training data with policy context, including fuel shortages and refugee outflows, so models do not conflate population displacement with productivity loss alone.
Informal Economy at Urban Edges
Peri-urban luminosity diffusion signals electrification of informal settlements before cadastral maps and tax rolls register new households, giving planners early notice of infrastructure stress. Edge growth appears as gradual brightening along transportation corridors, often lagging official urban boundary expansions by months or years. Economists pair lights trends with daytime building footprint datasets from open mapping projects to distinguish residential sprawl from industrial yard lighting. Machine learning segmentation on high-resolution daytime imagery can validate that new night lights correspond to housing rather than parking lots or security floodlights that do not imply equivalent economic value.
Informal workers operating without electricity contribute to GDP invisible to VIIRS. Street vendors with battery lamps, rural home-based labor without grid connections, and subsistence agriculture remain blind spots. Night lights models therefore report confidence intervals and auxiliary indicators rather than point estimates of unobserved activity. The ai night lights satellite economy literature recommends publishing elasticity assumptions so policymakers in Lagos, Nairobi, or São Paulo can judge whether local electrification patterns match global calibration samples used in published papers.
Frequently Asked Questions
Can night lights replace GDP statistics?
No. Luminosity proxies supplement official accounts, especially for timeliness and subnational granularity. National statistical agencies remain authoritative for tax, trade, and production data. Night lights excel when reports are delayed or disputed.
What is the cf_cvg band?
Cloud-free coverage indicates how many clear observations contributed to a composite pixel. Low values mean gap-filled or unreliable radiance. Mask low cf_cvg areas before training models or publishing maps.
Why did Ukraine lights mislead some analysts?
Curfews, deliberate blackouts, fires, and bombing created radiance patterns decoupled from underlying economic activity. Fusion indices that added search and social signals performed better than lights alone.
Are random forests reliable for economic forecasting?
They capture nonlinear patterns but overfit without geographic cross-validation. Compare against simple regression baselines and report out-of-sample errors by region and income level.
How do models detect informal growth?
Gradual luminosity diffusion at urban peripheries combined with daytime building footprint expansion suggests electrification of informal settlements. Validation requires local surveys because lighting intensity alone does not measure informal output value.
Which VIIRS product should I use?
NASA Black Marble VNP46A2 and annual composites provide moon-corrected radiance with quality flags. Match product version to replication studies and document preprocessing, including cf_cvg thresholds and stray light correction.
Operational humanitarian and development agencies increasingly ingest nightly VIIRS feeds into dashboards alongside food price monitors. The ai night lights satellite economy research community shares open pipelines on GitHub, lowering the barrier for journalists and NGOs to audit conflict impacts. Best practice pairs automated anomaly detection with human review of military chronologies, energy policy announcements, and known festival lighting before drawing causal conclusions about household welfare.
Henderson-style elasticities estimated on pre-LED decades require recalibration as cities retrofit street lighting and industries adopt dimmer spectra visible to VIIRS sensors. Econometric teams now include sensor upgrade dummies and compare NOAA-20 continuity against Suomi NPP baselines when constructing decade-long panels for AI research replication packages.
Subnational nowcasting for emerging markets benefits from combining lights with mobile money transaction aggregates where partnerships exist, reducing false positives when national grids expand into previously dark villages counted as growth spikes. Each additional modality demands privacy review, but the conceptual lesson from Warcast remains: single-sensor crisis narratives rarely survive scrutiny without multimodal corroboration.
Replication packages should publish preprocessing scripts that apply cf_cvg thresholds, document Black Marble version numbers, and share random forest hyperparameters so humanitarian analysts can audit Warcast-style indices before allocating emergency funds based on luminosity anomalies alone.