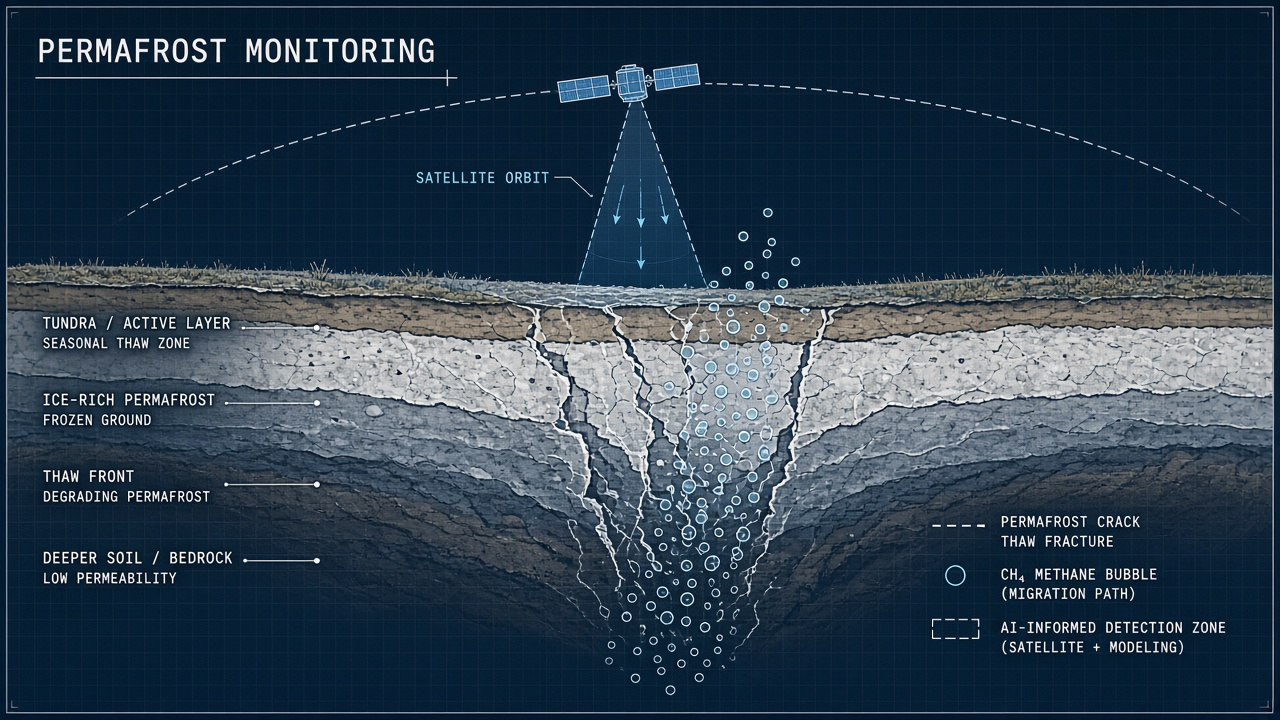
Arctic soils lock away roughly twice the carbon currently in the atmosphere, frozen for millennia in permafrost. As air temperatures climb, that ice-rich ground thaws, microbes decompose organic matter, and methane (CH4) and carbon dioxide (CO2) escape. Measuring where thaw accelerates and how much methane reaches the atmosphere is a planetary-scale monitoring problem. Permafrost thaw AI detection combines remote sensing, ground sensors, and machine learning to find thaw features, estimate active layer depth, and attribute methane anomalies to landscape change.
Climate scientists, Indigenous land managers, and carbon-accounting teams need timely maps, not annual summaries buried in PDF reports. Engineers exploring AI chatbot interfaces for environmental dashboards should know that permafrost products fuse physics-based models with learned pattern recognition. More applied AI explainers live on the EliteAI.tools blog index.
What Permafrost Thaw AI Detection Means in Plain Language
Permafrost thaw AI detection is the application of machine learning to satellite imagery, aerial surveys, and in situ sensor networks to identify thawing ground, expanding thermokarst lakes, retrogressive thaw slumps, and associated methane emissions faster than manual interpretation allows. Permafrost is ground that stays at or below 0 degrees C for at least two consecutive years. The active layer is the shallow zone that freezes and thaws annually. When the active layer deepens or ice-rich permafrost collapses, landscapes transform visibly from space.
AI does not replace thermodynamics. It scales expert judgment. A glaciologist might trace one thaw slump polygon by hand in a WorldView image; a convolutional neural network scores millions of pixels across the Arctic each week, flagging new slumps and linking them to methane hotspots detected by spectrometers on satellites such as TROPOMI (TROPOspheric Monitoring Instrument aboard Sentinel-5 Precursor).
| Thaw feature | Remote sensing signature | Gas flux relevance |
|---|---|---|
| Active layer deepening | Soil moisture and temperature trends | Gradual CO2 and CH4 release |
| Thermokarst lakes | Water body expansion in SAR and optical imagery | Ebullition hotspots at margins |
| Retrogressive thaw slumps | Headwall retreat, debris tongues | Pulse emissions after exposure |
| Ice wedge degradation | Polygon network disruption | Microtopography-driven redox shifts |
How the Detection Pipeline Works
A typical permafrost thaw AI pipeline ingests multi-sensor earth observation data, aligns ground truth from boreholes and eddy covariance towers, trains segmentation or regression models, and validates against independent field campaigns. Inputs span optical multispectral (Landsat, Sentinel-2), synthetic aperture radar (Sentinel-1, PALSAR), thermal infrared, digital elevation models, and atmospheric methane columns from hyperspectral sensors.
Methane column retrieval and fusion
TROPOMI measures total column average dry-air mole fraction of methane (XCH4) globally at roughly 7 km by 3.5 km resolution, with daily revisits. Researchers correlate spatial anomalies with soil temperature, wetland extent, and thaw proxies. In the Hudson Bay Lowlands, a major boreal wetland complex, published analyses report Pearson correlation coefficients between XCH4 and soil temperature from R = 0.63 to R = 0.87 depending on season and spatial aggregation, demonstrating that satellite methane fields track thermal drivers of microbial production.
Landscape segmentation with convolutional networks
Thaw slumps produce sharp headwalls and sediment tongues visible in sub-meter commercial imagery. UNet3+ architectures, an encoder-decoder CNN family with nested skip pathways, segment slump scars from WorldView-2 and WorldView-3 scenes. Reported intersection-over-union (IoU) near 0.75 on held-out tiles indicates the model captures most slump area, though boundary pixels remain challenging where shadows mimic debris.
GeoCryoAI ensemble framework
GeoCryoAI integrates ensemble machine learning to predict active layer thickness (ALT), methane flux, and carbon dioxide flux across Alaska by fusing terrain attributes, climate reanalysis, remote sensing indices, and field measurements. Ensemble methods reduce variance when individual algorithms overfit sparse borehole networks. The framework targets operational monitoring for agencies managing Arctic infrastructure and carbon budgets.
Field validation and uncertainty quantification
No Arctic AI product survives peer review without explicit comparison to chamber flux measurements, eddy covariance towers, and borehole temperature strings. Best practices report prediction intervals, not just point estimates, because policymakers use these maps to allocate monitoring flights and community adaptation funds. Spatial cross-validation that holds out entire watersheds, rather than random pixels, gives more honest error bars when models interpolate between widely spaced boreholes. Teams publishing operational dashboards should version-control training data and document which satellite sensors (Sentinel-1, Landsat 8, MODIS land surface temperature) fed each annual map layer.
Linking thaw features to carbon cycle models
Detected slump polygons and ALT deepening rates become boundary conditions for terrestrial ecosystem models and Earth system models participating in IPCC assessments. When a CNN inventory shows accelerating headwall retreat along a river corridor, modelers can increase lateral carbon export parameters in that grid cell. Methane column anomalies from TROPOMI provide top-down constraints that bottom-up soil models must reconcile. Closing the loop between geomorphic AI and biogeochemistry remains an active research frontier, but early coupled workflows already inform Permafrost Carbon Network synthesis reports.
- Acquire satellite and climate forcing datasets for the study region.
- Compile in situ soil temperature, ALT probes, and chamber flux measurements.
- Engineer geospatial features (topography, vegetation index, distance to water).
- Train segmentation models for landforms and regression ensembles for flux variables.
- Validate with spatial cross-validation to avoid autocorrelation inflation.
- Publish uncertainty maps alongside predictions for policy users.
Published Evidence and Operational Use
Peer-reviewed results show moderate to strong correlations between satellite methane and thermal proxies, plus CNN slump mapping IoU around 0.75, but pan-Arctic upscaling still carries large uncertainty bands. Hudson Bay Lowlands TROPOMI analyses anchor methane detection to soil temperature with R up to 0.87, supporting the hypothesis that warming soils drive emission variability at regional scale. The correlation is not uniform: spring thaw, water table depth, and vascular plant transport modulate fluxes in ways a single predictor cannot capture.
GeoCryoAI demonstrations in Alaska illustrate how ensembles translate heterogeneous observations into continuous ALT and gas flux fields, helping prioritize field campaigns. UNet3+ slump detection on WorldView imagery gives geomorphologists event inventories faster than manual digitization, enabling before-after comparisons after heat waves.
National mapping programs and IPCC-aligned carbon inventories increasingly request reproducible thaw indicators. AI products feed into regional climate models as boundary conditions and inform infrastructure risk screening for roads and pipelines built on ice-rich permafrost.
Infrastructure and permafrost monitoring
The Dalton Highway, Russian Arctic oil fields, and Canadian mine haul roads all sit on ice-rich ground. Operators commission repeat WorldView acquisitions specifically to feed slump detection models that quantify how quickly cut slopes destabilize after warm summers. Early warning of accelerating thaw lets engineers reroute traffic, insulate embankments, or schedule emergency berms before catastrophic subsidence. AI slump maps reduce manual photointerpretation labor from weeks to days across corridor-length study areas, though geotechnical boreholes still determine whether remediation is economically justified.
Limits, Risks, and Ethical Guardrails
Arctic AI monitoring risks false precision: a crisp map can imply confidence that field data do not support, especially where ground observations are sparse across Indigenous homelands and protected areas. Satellite methane columns integrate emissions from multiple sources (wetlands, fossil fuel, fires), so attributing a pixel to permafrost thaw requires careful source separation and meteorological modeling.
- Spatial resolution: TROPOMI pixels average over kilometers, blurring small slump fluxes.
- Cloud cover: Optical slump detection fails under persistent Arctic cloud; SAR helps but adds speckle noise.
- Training bias: Models trained on accessible sites may underrepresent remote tundra.
- Temporal sparsity: Commercial sub-meter imagery is costly, limiting annual revisit for training labels.
- Policy misuse: Emission maps could affect land-use decisions without community consent.
Ethical guardrails include co-production with Arctic communities, open publication of uncertainty, data sovereignty agreements for traditional territories, and transparent separation of natural flux from industrial methane when reporting national inventories. Climate justice demands that monitoring benefits local adaptation planning, not only distant carbon markets.
Who Should Use This and Who Should Wait
Permafrost researchers, Arctic infrastructure engineers, and national greenhouse gas inventory teams should pilot AI thaw and methane products now with field validation budgets. Carbon offset developers should wait for standardized verification protocols before claiming permafrost credits based on satellite models alone.
| Audience | Recommendation | Caveat |
|---|---|---|
| Arctic research consortium | Integrate TROPOMI anomalies with soil sensor networks | Attribute mixed methane sources explicitly |
| Infrastructure operator | Use slump detection CNNs for corridor monitoring | Confirm with lidar and geotechnical boreholes |
| National inventory agency | Pilot GeoCryoAI-style ensembles for regional flux maps | Report uncertainty ranges in submissions |
| Carbon credit investor | Wait for verified methodologies | Satellite-only claims are not audit-ready |
Frequently Asked Questions
Can TROPOMI detect methane from permafrost thaw directly?
TROPOMI detects column methane enhancements correlated with soil temperature in thaw-sensitive regions like the Hudson Bay Lowlands (R = 0.63 to 0.87), but it cannot isolate permafrost thaw from other wetland and anthropogenic sources without additional modeling. Use TROPOMI as a regional alarm, not a slump-level flux meter.
How accurate is AI slump mapping from satellite imagery?
UNet3+ models on WorldView imagery report IoU around 0.75 for retrogressive thaw slumps, meaning substantial overlap with manual labels but imperfect edge capture. Accuracy drops on new geomorphic settings without retraining.
What does GeoCryoAI predict?
GeoCryoAI ensemble models estimate active layer thickness, methane flux, and carbon dioxide flux across Alaska by fusing remote sensing, terrain, and field data. Outputs support monitoring and hypothesis generation, not replacement for eddy covariance towers.
Should I use SAR or optical imagery for thaw monitoring?
Optical imagery excels at geomorphic visual features; SAR penetrates clouds and senses surface moisture changes linked to thaw. Operational systems increasingly fuse both modalities with terrain models.
Why is methane attribution to permafrost difficult?
Wetlands, fossil fuel infrastructure, biomass burning, and thawing soils all elevate methane within coarse satellite pixels, so atmospheric transport models and isotopic ground truth are needed for attribution. AI correlation with soil temperature is evidence, not proof of exclusive permafrost origin.
How should Arctic communities govern monitoring data?
Community-led data agreements should precede large-scale AI monitoring on traditional lands, specifying who owns observations, who benefits from findings, and how maps inform local adaptation. Open science ideals must balance with Indigenous data sovereignty principles.
Conclusion
Permafrost thaw AI detection stitches together TROPOMI methane columns correlated with soil temperature, GeoCryoAI ensembles for Alaska ALT and gas flux, and UNet3+ segmentation of thaw slumps at IoU 0.75 on high-resolution WorldView imagery. The approach scales Arctic vigilance beyond what manual mapping can sustain. Limits remain: mixed methane sources, cloud cover, sparse ground truth, and policy contexts that demand community partnership. Teams should treat AI maps as decision support with explicit uncertainty, field validation, and ethical review, not as final carbon accounting ledgers.