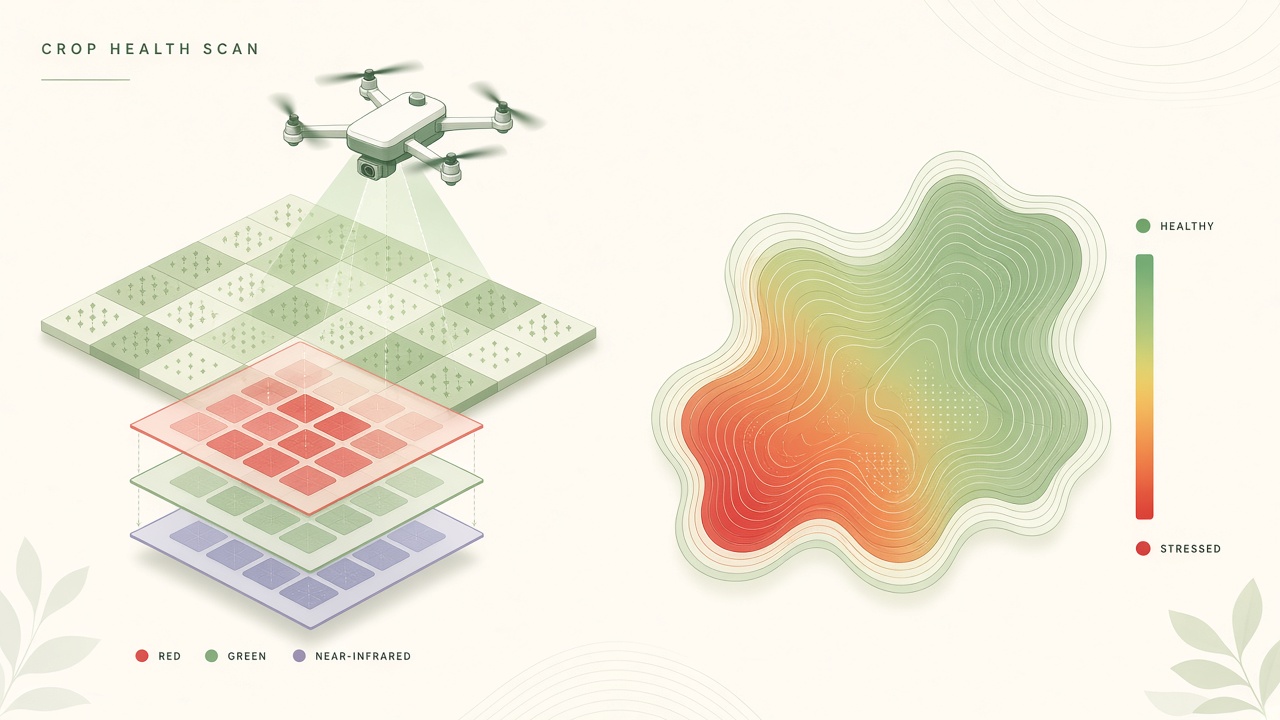
AI crop disease detection from drone multispectral imagery identifies plant stress in near-infrared and red-edge bands before human scouts see lesions, then exports georeferenced prescription maps to variable-rate sprayers. Convolutional and transformer models trained on labeled flight tiles classify fungal, bacterial, and viral patterns while separating nutrient deficiency and drought stress that mimic disease in RGB photos alone. Platforms from Sentera, MicaSense, DJI Agras workflows, and research systems like AgroVisionNet fuse spectral indices with soil moisture and temperature sensors for field-ready inference on edge GPUs. Agronomists tracking AI research on precision agriculture or browsing popular AI tools for remote sensing should understand which band combinations and ground sampling distances fit corn broadacre versus vineyard canopy geometry.
Why Early Detection Saves Yield
Fungal and bacterial pathogens reduce yield most when infection spreads undetected through the latent period; multispectral stress maps let growers treat hotspots before spores colonize adjacent rows. Northern corn leaf blight, wheat Fusarium head blight, grape downy mildew, and soybean rust each follow different epidemiological curves, but all share a window where physiological stress precedes visible necrosis. Peer-reviewed drone studies report classification accuracy above 93 percent when multispectral frames are paired with temporal sequences, and federated learning frameworks on distributed farms reached 93.2 percent detection accuracy while cutting communication overhead by roughly 42 percent compared with centralized training.
Economic impact scales with crop value and treatment cost. A 50-acre vineyard block losing 15 percent tonnage to powdery mildew costs more in lost revenue than a variable-rate sulfur pass triggered by an NDVI anomaly map. Broadacre corn may tolerate localized infection if prescription fungicide limits product to infected zones, saving 30 to 60 percent of chemical volume versus blanket application. Early maps also support insurance and sustainability documentation: timestamped flight logs prove integrated pest management actions for buyer audits.
Human scouting remains essential for ground-truthing, but walk-throughs sample a fraction of field area. Drones cover hundreds of acres per flight at consistent altitude, reducing bias from scouts who unconsciously favor accessible headlands. AI layers flag tiles exceeding anomaly thresholds so agronomists visit the highest-risk polygons first, concentrating expert time where treatment decisions matter most.
Multispectral Band Selection
Effective disease models combine visible red and green channels with near-infrared, red-edge, and sometimes thermal bands; NDVI alone misses early chlorophyll disruption that red-edge indices capture. Normalized Difference Vegetation Index (NDVI) measures general vigor but conflates nitrogen stress, compaction, and root rot. Red-edge bands near 705 to 750 nanometers respond earlier to chlorophyll degradation from rust and blight. Thermal infrared highlights transpiration failures when stomata close under pathogen attack. Research on wheat Fusarium head blight correlated multispectral NDVI from unmanned aircraft with deoxynivalenol contamination, linking spectral decline to food-safety risk.
Hyperspectral sensors capture dozens of narrow bands for laboratory-grade discrimination but increase payload weight, cost, and processing time. Five-band multispectral cameras from MicaSense RedEdge and Parrot Sequoia balance field practicality with enough spectral resolution for CNN classifiers. Some 2025 frameworks use 3D spectral-spatial convolutional networks on hyperspectral cubes, achieving near 95 percent accuracy in under 0.3 seconds per sample on research hardware, though commercial deployments more often use five to ten bands on fixed-wing or multicopter platforms.
Atmospheric correction matters when comparing flights across dates. Clear-sky calibration panels and radiometric correction normalize reflectance so a Tuesday flight matches a Friday follow-up. Cloud shadow and variable sun angle introduce false stress signals; pipelines flag tiles with low illumination quality before model inference. Seasonal baselines per growth stage prevent flagging senescing lower leaves as disease in late-season corn.
| Index or band | What it indicates | Disease detection role |
|---|---|---|
| NDVI | Overall canopy vigor | Broad stress screening; weak alone for pathogen ID |
| NDRE (red-edge) | Chlorophyll content change | Early fungal and bacterial stress before yellowing |
| GNDVI | Green band chlorophyll proxy | Separates nutrient stress from pathogen patterns |
| Thermal | Canopy temperature | Transpiration failure, water stress confounds |
Flight Planning and GSD Tradeoffs
Ground sampling distance (GSD), the centimeters per pixel on the ground, determines whether models see individual leaves or only canopy patches; lower GSD improves early detection but shrinks acres covered per battery swap. Flying at 40 meters altitude with a RedEdge-class sensor often yields 5 to 8 centimeters per pixel, suitable for row crops and early lesion detection. Vineyards may require 2 to 4 centimeters per pixel on cordon arms, demanding slower passes or higher-resolution payloads. Overlap of 75 percent forward and 65 percent side overlap ensures orthomosaic stitching without gaps; insufficient overlap creates seam artifacts that CNNs misread as disease boundaries.
Flight timing interacts with crop physiology. Mid-morning flights after dew dries reduce specular glare on waxy leaves. Wind above 15 mph degrades multicopter stability and blurs frames. Regulatory Part 107 rules in the United States require licensed pilots; BVLOS waivers expand corridor scouting on large farms but add paperwork. RTK-GPS geotagging aligns each pixel to prescription sprayer coordinates within 2 to 5 centimeters when base stations are available.
Battery logistics cap daily acreage. A typical multicopter covers 80 to 150 acres per day depending on GSD and overlap; fixed-wing platforms extend range on flat broadacre but struggle in irregular vineyard terrain. Plan flights before growth stage transitions: pre-tassel corn, bloom grapes, and heading wheat each need model recalibration or stage-specific thresholds.
Labeling Diseased vs Nutrient Stress
Training datasets need expert labels that distinguish pathogen signatures from nitrogen deficiency, compaction, and herbicide drift, because multispectral anomalies alone cannot separate these causes. Labeling workflows start with agronomist field visits to flagged polygons. Technicians draw bounding boxes or segmentation masks on orthomosaic tiles, tagging species-specific symptoms: rust pustules, blight lesions, mildew sporulation. Minimum viable datasets range from hundreds of tiles per disease class for transfer learning atop ImageNet-pretrained backbones to thousands for production-grade recall across soil types.
Confusion matrices in published work show nutrient stress misclassified as disease when nitrogen is limiting across whole zones; spatial pattern helps: uniform decline suggests fertility, patchy clusters suggest pathogen spread. Federated learning lets regional cooperatives train shared models without uploading raw imagery off-farm, preserving grower privacy while improving local weed and disease species coverage. Tomato leaf severity grading research using edge UAV inference demonstrates four-class labels (healthy, low, medium, high severity) outperforming binary sick-or-healthy outputs for treatment timing.
Active learning loops accelerate labeling: the model surfaces uncertain tiles for expert review first. Season-over-season, growers append new labels from failed predictions, reducing false positives that trigger unnecessary fungicide spend. Document label provenance and date for regulatory audits when pesticide applications trace back to AI-generated maps.
Export to Variable-Rate Sprayers
Prescription maps export as shapefiles or ISO-XML rate files that variable-rate sprayers and spreaders consume, converting classified polygons into per-zone chemical application rates. AgroVisionNet and commercial farm software pipelines generate GeoTIFF heatmaps and vector zones with recommended liters per hectare. John Deere Operations Center, Climate FieldView, and Raven Slingshot import these layers onto in-cab displays. Sprayer controllers adjust nozzle pulse width or sectional shutoff as the boom crosses infection boundaries. Savings depend on disease prevalence: scattered hotspots reward VR; uniform epidemics approach blanket rates anyway.
Latency from flight to spray matters for fast-moving pathogens. Same-week turnaround is the operational target: fly Monday, label and infer Tuesday, ground-truth Wednesday, spray Thursday before rain. Edge inference on NVIDIA Jetson-class hardware during flight enables same-day alerts for critical blocks, with full orthomosaic refinement overnight. TensorFlow Lite deployments on Jetson Nano demonstrate feasibility for research prototypes; commercial ops more often process in cloud or field laptops after landing.
Integration with IoT soil and weather stations improves decisions: high humidity and leaf wetness hours after a flagged map may accelerate spray urgency. Conversely, dry forecasts may allow monitoring passes before committing product. Always align AI recommendations with label pre-harvest intervals and regional extension guidance; models suggest where to look, agronomists authorize treatment.
Commercial Platforms and Vendor Landscape
Commercial drone analytics platforms bundle flight planning, orthomosaic stitching, vegetation indices, and optional disease classifiers so growers without GIS staff can operate repeatable scouting programs. DJI Terra and DroneDeploy ingest multispectral imagery from MicaSense and Parrot sensors, computing NDVI, NDRE, and VARI maps within hours of landing. Sentera FieldAgent pushes disease stress layers into Climate FieldView for corn and soybean customers. Taranis and Ceres Imaging sell subscription scouting with agronomist review on top of algorithmic alerts. Pricing ranges from per-acre seasonal contracts on large farms to per-flight fees for specialty growers under 500 acres.
Vendor disease models vary in transparency: some publish validation studies by crop and region; others treat classifiers as black boxes. Before signing multi-year contracts, request confusion matrices on your cultivar and ask whether models update from your labeled feedback. Open-source pipelines using QGIS, OpenDroneMap, and PyTorch notebooks suit research stations and consultant agronomists who want full control over band math and training data.
Insurance and input suppliers increasingly subsidize first-season flights to demonstrate variable-rate savings. Document baseline yield maps and spray records so year-two ROI comparisons isolate drone value from weather luck. Pair aerial maps with tissue tests when spectral stress could be potassium deficiency rather than rust, avoiding misdirected fungicide spend.
Frequently Asked Questions
Does multispectral drone detection work for wheat diseases?
Yes for several pathogens. Published work links multispectral NDVI to Fusarium head blight severity and DON contamination risk. Stripe rust and powdery mildew also alter red-edge reflectance before full-field yellowing. Ground-truth head counts remain necessary because head-size variation affects spectral response at heading stage.
What about grapes and vineyard canopy?
Vineyards benefit from higher GSD and row-aligned flight paths that capture both sides of canopy walls. Downy and powdery mildew show early spectral stress on infected leaves tucked inside the canopy. Terrain-following drones help on slopes. Variable-rate sulfur or fungicide via ATV or electrostatic sprayers uses exported polygons row by row.
How much cloud cover is acceptable?
Consistent illumination matters more than perfect blue sky. Thin high cloud may work with radiometric calibration; broken cloud casting moving shadows corrupts mosaics. Postpone flights when shadow fraction exceeds vendor thresholds, typically above 20 percent of tiles flagged unusable.
Is NDVI enough without AI?
NDVI thresholds alert general stress but cannot classify disease species or separate nutrient issues. Machine learning on multispectral stacks plus temporal change detection materially improves specificity. Simple NDVI alerts remain a valid entry point before investing in labeled training data.
Corn vs small grains: different workflows?
Corn broadacre favors fixed-wing coverage and lower GSD per acre budget; disease often appears mid-canopy requiring oblique angles or later growth-stage timing. Small grains need heading-stage flights for head diseases and earlier tillering passes for foliar rust. Model bundles should be crop-specific.
Who owns flight imagery and labels?
Contract terms vary by drone service and software vendor. Federated learning reduces raw-image upload requirements. Growers should clarify data retention, model reuse, and whether imagery is shared across clients before signing service agreements.
Where to follow crop sensing research?
Venues include Precision Agriculture, Scientific Reports remote sensing papers, and extension publications from land-grant universities. For broader machine learning trends in agriculture, follow AI research coverage on edge vision and geospatial models.