You quote a feature to leadership: "API costs five dollars per million tokens." Engineering ships a RAG chatbot. Finance receives a twelve-hundred-dollar invoice because output tokens doubled input, retries ran uncapped, and the team defaulted to a flagship model for every query. Understanding AI API pricing per million tokens is how you translate vendor rate cards into budgets that survive production traffic.
This guide covers input vs output pricing, cached and batch discounts, model tier spreads, forecasting from sample workloads, and budget alerts. Developers evaluating AI API tools and AI coding assistants should build a forecast spreadsheet before launch, not after the first billing cycle.
Input vs Output Token Pricing
Most LLM APIs charge separately for input tokens (prompt, context, retrieved documents) and output tokens (completion). Output rates are often higher per token because generation consumes more compute. Long system prompts and fat RAG context inflate input cost even when answers stay short.
Example structure (illustrative, not vendor-specific): if input is three dollars per million tokens and output is fifteen dollars per million tokens, a request with four thousand input and one thousand output tokens costs roughly zero point zero one two dollars per call. At one hundred thousand calls monthly, that is eleven thousand two hundred dollars. Small per-call math compounds fast.
Cached and Batch Discount Mechanics
Prompt caching discounts repeat input segments that stay identical across requests. System instructions, tool schemas, and static knowledge chunks may qualify when the platform recognizes cache hits. Batch APIs offer lower rates for workloads tolerant of delayed responses. Both require intentional architecture, not accidental savings.
- Place stable prompt prefix first; vary user content after the cacheable block.
- Monitor cache hit metrics in provider dashboards.
- Route non-urgent jobs to batch endpoints when latency SLAs allow.
Model Tier Price Spreads
Flagship models cost multiples of small or distilled models. Price spreads of ten to twenty times between tiers are common. Defaulting every request to the largest model is the fastest path to bill shock. Route simple classification to small models; reserve large models for steps that fail quality checks on cheaper tiers.
| Model tier | Typical use | Cost posture |
|---|---|---|
| Small / fast | Routing, tagging, short replies | Lowest per-token rates |
| Mid | General assistant, moderate reasoning | Balanced default for many apps |
| Flagship | Complex analysis, long codegen | Highest rates; use selectively |
Forecasting From Sample Workloads
Build a forecast from measured token counts on representative traffic, then apply growth and retry buffers. Spreadsheet columns: request type, calls per month, avg input tokens, avg output tokens, model tier, price per million in/out, extended cost, retry multiplier.
| Workload | Monthly calls | In / out tokens | Est. cost band |
|---|---|---|---|
| Support triage bot | 50,000 | 2,000 / 400 | Moderate; watch context bloat |
| Code review assistant | 8,000 | 12,000 / 3,000 | High; large file context |
| Internal FAQ search | 120,000 | 1,500 / 250 | Low per call; volume driven |
Log token usage in staging with production-like prompts. Add fifteen to twenty-five percent buffer for retries, eval runs, and traffic growth.
Budget Alerts and Hard Caps
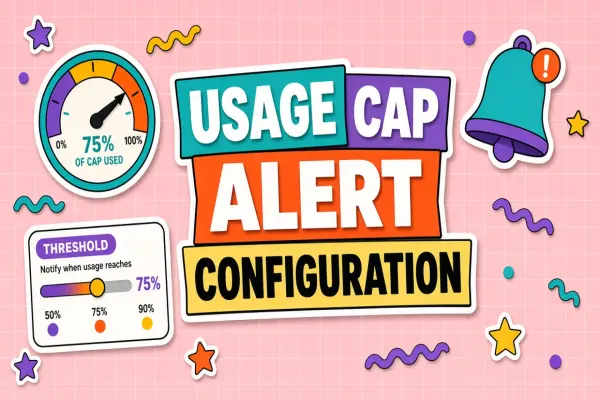
Configure spending limits, email alerts at fifty and eighty percent of budget, and hard stops for pre-production keys. Separate development and production projects with distinct keys and limits. Rotate keys if a leak causes runaway loops. Review dashboards weekly during rollout, daily during launches.
Building a token pricing calculator
A practical token pricing calculator for LLM API pricing explained workflows uses five inputs per endpoint: requests per day, average input tokens, average output tokens, model price card, and retry rate. Export daily totals from staging logs for two weeks before multiplying by thirty. OpenAI API cost estimate templates from vendors are starting points; replace every default with your measured p95 token counts because tail latency drives cost more than averages in document-heavy apps.
Frequently Asked Questions
How do image and audio API prices relate to token pricing?
Image and audio endpoints often bill per image, per second, or per character instead of LLM tokens. Hybrid apps must sum line items: chat tokens plus image generations plus transcription minutes. Build separate worksheet tabs per modality.
How do I estimate OpenAI-style API cost quickly?
Multiply measured input and output tokens by published per-million rates for your chosen model. Add tool call overhead and embedding costs if using RAG. Provider calculators help sanity-check but replace defaults with your logged averages.
Should we build an internal token pricing calculator?
A lightweight spreadsheet or internal dashboard tied to logged token metrics beats static calculators. Update rate cards when vendors change pricing; stale multipliers underestimate spend within weeks.
The Bottom Line
AI API pricing per million tokens splits input and output, varies sharply by model tier, and drops with caching and batch patterns when architected deliberately. Forecast from real token logs, add retry buffers, and enforce alerts and caps. Explore AI API and coding tools on EliteAI.tools after your spreadsheet reflects production-shaped traffic.