What is Theory A?
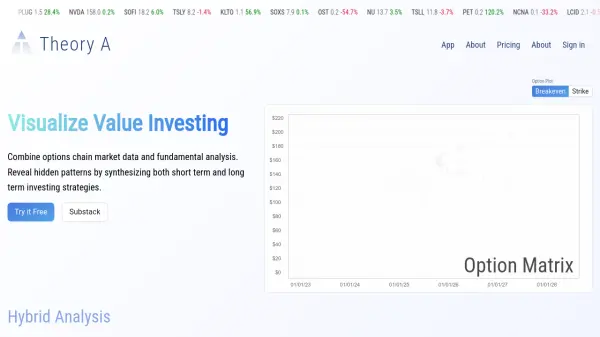
Theory A offers a comprehensive investment analysis platform that synthesizes options chain market data with fundamental analysis. Users can overlay key metrics such as earnings, market capitalization, and options matrix to uncover hidden opportunities in value investing. The tool enables investors to visualize price-to-earnings dislocations, analyze profit and loss scenarios in 3D, and contextualize stock data using intuitive visualizations and decile breakdowns.
Theory A supports multiple time horizons and provides features for comparing multiple stocks, tracking upcoming earnings, and managing trade journals. Its robust stock screener and data contextualizer help users make informed decisions by clearly displaying both historical and current analytic insights. All research and visualizations are provided as decision support tools for individual investors conducting their own due diligence.
Features
- Hybrid Analysis: Combine options chain data with fundamental analysis metrics.
- Market Data Overlays: Display earnings, market cap, and options matrix together.
- Intuitive P/E Dislocations: Contextualize P/E ratios historically.
- 3D Options Chain Visualization: View options chains and P&L charts in an interactive 3D format.
- Stock Screener: Filter and compare stocks across multiple metrics.
- Decile Breakdown: Contextualize values relative to market peers.
- Trading Journal: Manage and review trading activity.
- Multiple Timeframe Support: Analyze data over spans from 2 to 20 years.
- Experimental Tools: Access unique features like the Kelly Game and Entropy Calculator.
- Upcoming Earnings Tracker: Monitor earnings reports for selected stocks.
Use Cases
- Screening stocks for value investing opportunities using combined technical and fundamental data.
- Analyzing options chains to generate advanced trading strategies.
- Comparing historical and current P/E ratios for potential investment analysis.
- Visualizing profit and loss projections for complex option strategies.
- Maintaining a trading journal to track and refine investment decisions.
- Monitoring upcoming earnings and other key financial events.
- Contextualizing stock performance across multiple timeframes and metrics.
FAQs
-
What features are included in the free plan?
The free plan offers access to over 10 screening metrics, limited dislocations, and basic options overlay features. -
What benefits does the premium plan provide?
The premium plan grants unrestricted access to all 30+ screening metrics, all dislocations, and full options overlay capabilities for $29.99 per month. -
Can I use Theory A to compare multiple stocks at the same time?
Yes, Theory A provides tools to compare multiple stocks and analyze their relative data across key metrics. -
Is Theory A suitable for tracking both short-term and long-term investments?
Yes, the platform supports analysis across multiple timeframes, from 2-year up to 20-year historical views.