What is Infograph.app?
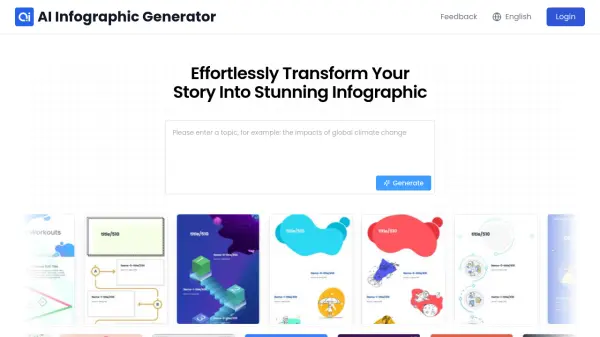
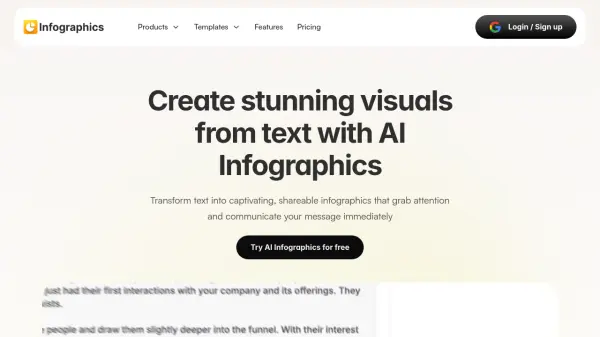
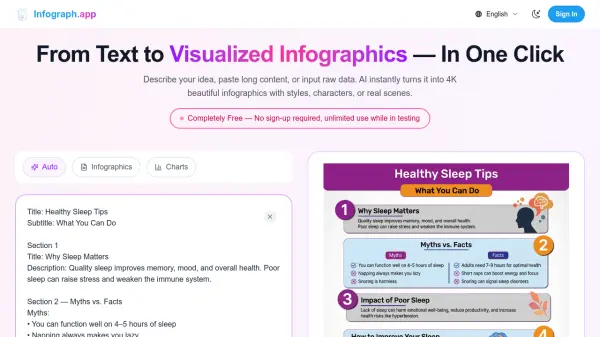
Infograph.app transforms text, documents, and raw data into visually stunning infographics with just one click. The platform utilizes artificial intelligence to instantly generate 4K resolution infographics, charts, diagrams, and visual representations that effectively communicate complex information.
Users can customize their creations with different styles, characters, or real scenes, making it suitable for a wide range of applications from academic projects to business presentations. The tool supports multiple languages, provides precise text rendering, and offers extensive customization options including editable templates, whiteboard-style diagrams, and the ability to clone existing designs while maintaining visual consistency.
Features
- Instant Generation: Converts text, documents, or raw data into infographics and charts in seconds
- 4K Resolution: Supports high-quality outputs ideal for presentations and professional use
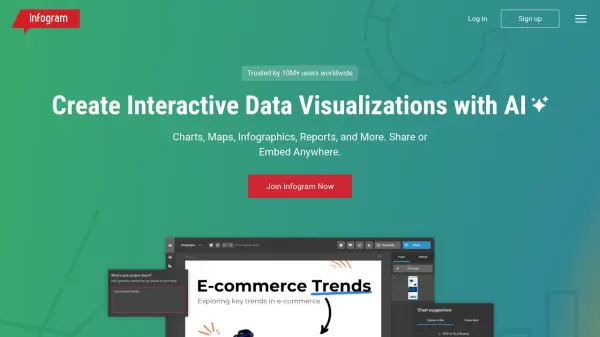
- Multiple Chart Types: Creates infographics, flow charts, organizational charts, mind maps, and timeline templates
- Whiteboard Diagrams: Generates professional whiteboard-style diagrams for presentations and educational content
- Style Cloning: Recreates existing infographic layouts while replacing the content with your own
- Multi-language Support: Offers precise text rendering across multiple languages
- Editable Templates: Provides 500+ free infographic template styles for various needs
- Visual Customization: Allows adjusting layouts, colors, and styles to match your requirements
Use Cases
- Students creating visual summaries and concept maps for academic projects
- Researchers visualizing complex data and literature reviews
- Teachers developing visual teaching aids for classroom instruction
- Marketers designing clean visuals for social media and presentations
- Business teams creating process charts and workflow diagrams
- Content creators generating infographics for blogs and websites
- Educators translating complex lessons into simple visual explanations
- Product managers visualizing product information and workflows
How It Works
Paste Your Idea, Text or Data
Paste a paragraph, an outline, a blog post, class notes, or even structured data. Describe what you need: "timeline infographic about climate change", Our infographic generator analyses the text instantly.
Customize the Design
Click the Edit Infographic feature and enter your ideas about layouts, colors, icons, and style.
Generate or Export
Download your infographic images or chart pdf, timeline infographic, chart, or concept map in one click.
FAQs
-
What is Infograph.app?
Infograph.app is an AI-powered tool that instantly transforms text, content, or raw data into beautiful 4K infographics, charts, and diagrams with customizable styles and formats. -
What types of infographics can I create?
You can create various types of infographics including flow charts, organizational charts, mind maps, timeline templates, comparison charts, bar charts, histograms, and whiteboard-style diagrams. -
Is Infograph.app free?
Infograph.app offers a free version with unlimited use during testing phase with no sign-up required. There are also paid subscription plans starting from $89/month offering additional features and credits. -
How to make an infographic with AI easily?
To create an infographic with Infograph.app, simply paste your text, idea, or data, customize the design if needed, and generate or export your infographic with one click.