JMeter MCP Server
Execute and analyze JMeter tests via Model Context Protocol integration.
Key Features
Use Cases
README
🚀 JMeter MCP Server
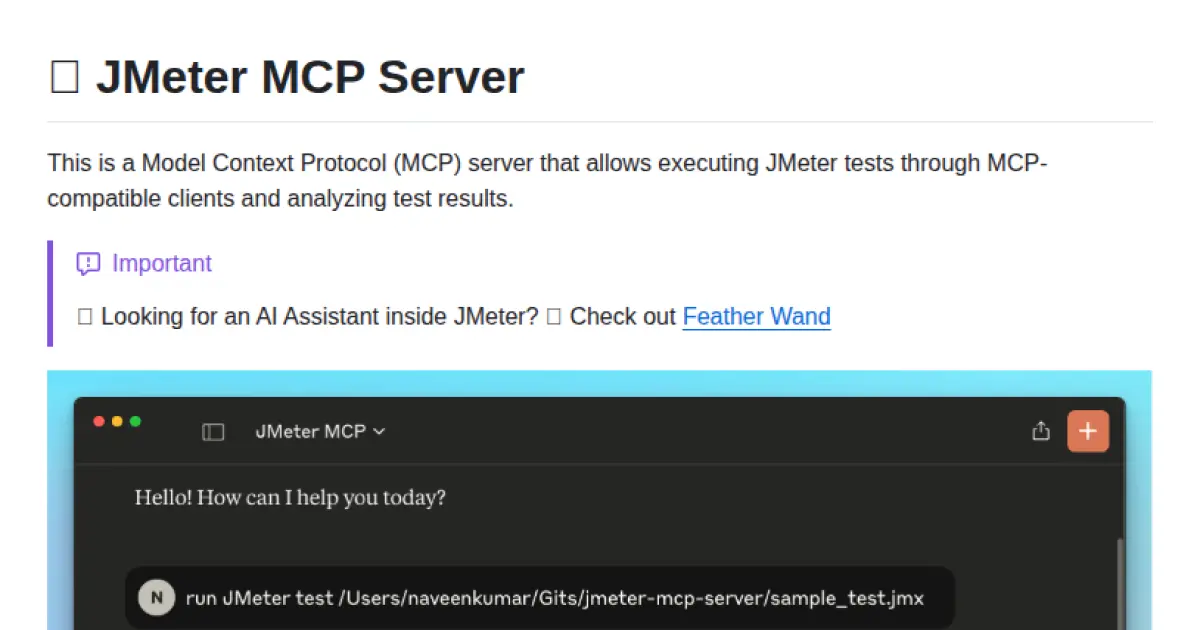
This is a Model Context Protocol (MCP) server that allows executing JMeter tests through MCP-compatible clients and analyzing test results.
[!IMPORTANT] 📢 Looking for an AI Assistant inside JMeter? 🚀 Check out Feather Wand
📋 Features
JMeter Execution
- 📊 Execute JMeter tests in non-GUI mode
- 🖥️ Launch JMeter in GUI mode
- 📝 Capture and return execution output
- 📊 Generate JMeter report dashboard
Test Results Analysis
- 📈 Parse and analyze JMeter test results (JTL files)
- 📊 Calculate comprehensive performance metrics
- 🔍 Identify performance bottlenecks automatically
- 💡 Generate actionable insights and recommendations
- 📊 Create visualizations of test results
- 📑 Generate HTML reports with analysis results
🛠️ Installation
Local Installation
-
Install
uv: -
Ensure JMeter is installed on your system and accessible via the command line.
⚠️ Important: Make sure JMeter is executable. You can do this by running:
chmod +x /path/to/jmeter/bin/jmeter
- Install required Python dependencies:
pip install numpy matplotlib
- Configure the
.envfile, refer to the.env.examplefile for details.
# JMeter Configuration
JMETER_HOME=/path/to/apache-jmeter-5.6.3
JMETER_BIN=${JMETER_HOME}/bin/jmeter

# Optional: JMeter Java options
JMETER_JAVA_OPTS="-Xms1g -Xmx2g"
💻 MCP Usage
-
Connect to the server using an MCP-compatible client (e.g., Claude Desktop, Cursor, Windsurf)
-
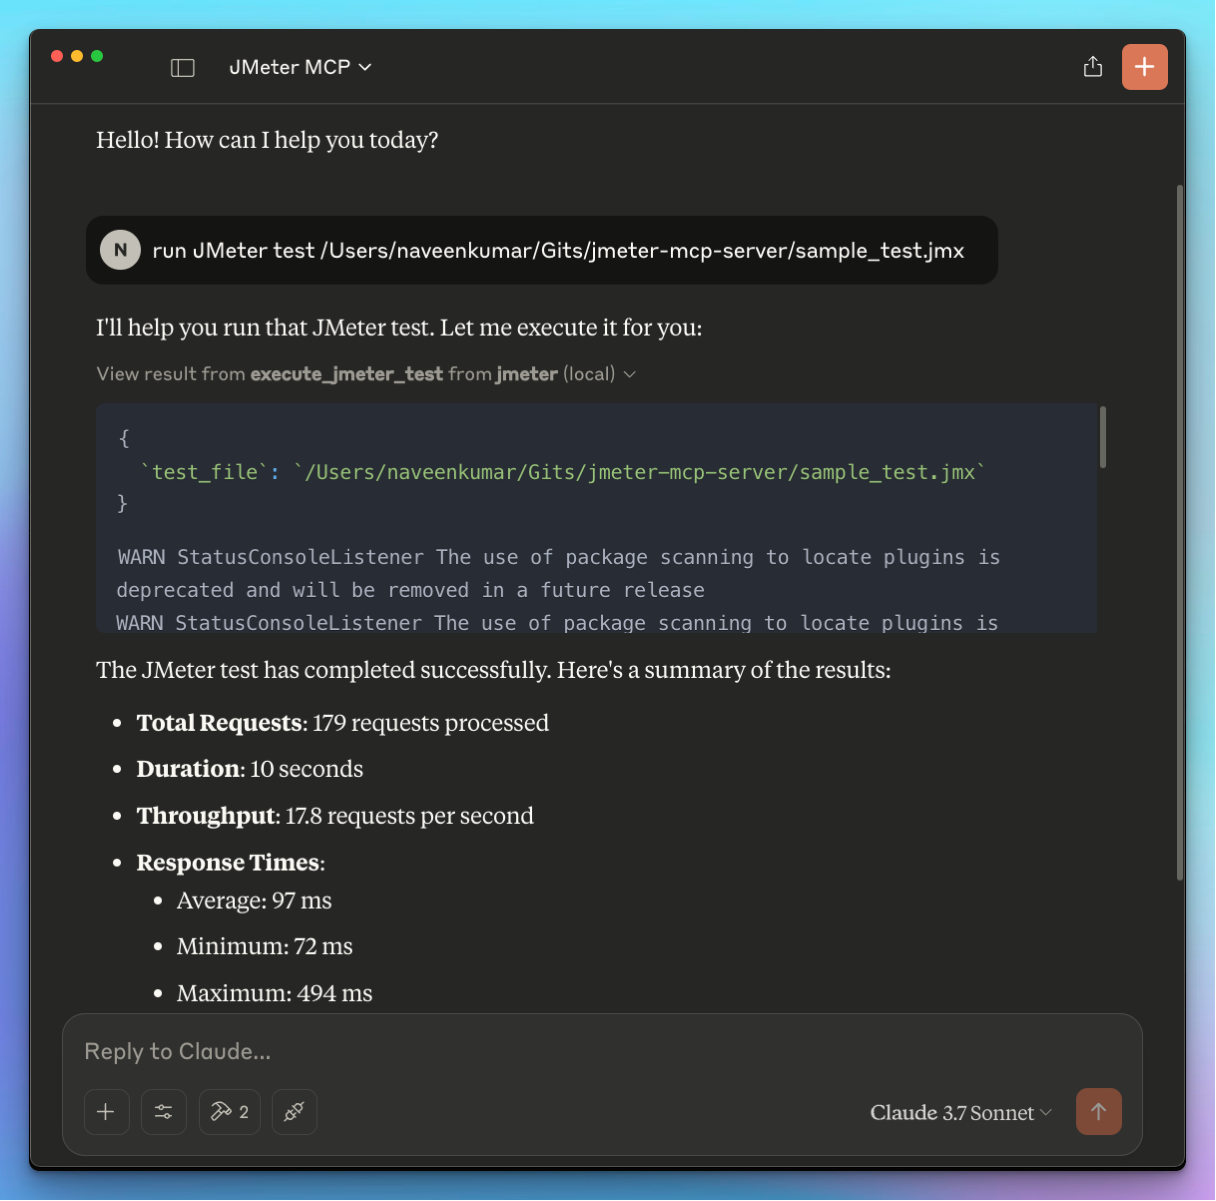
Send a prompt to the server:
Run JMeter test /path/to/test.jmx
- MCP compatible client will use the available tools:
JMeter Execution Tools
- 🖥️
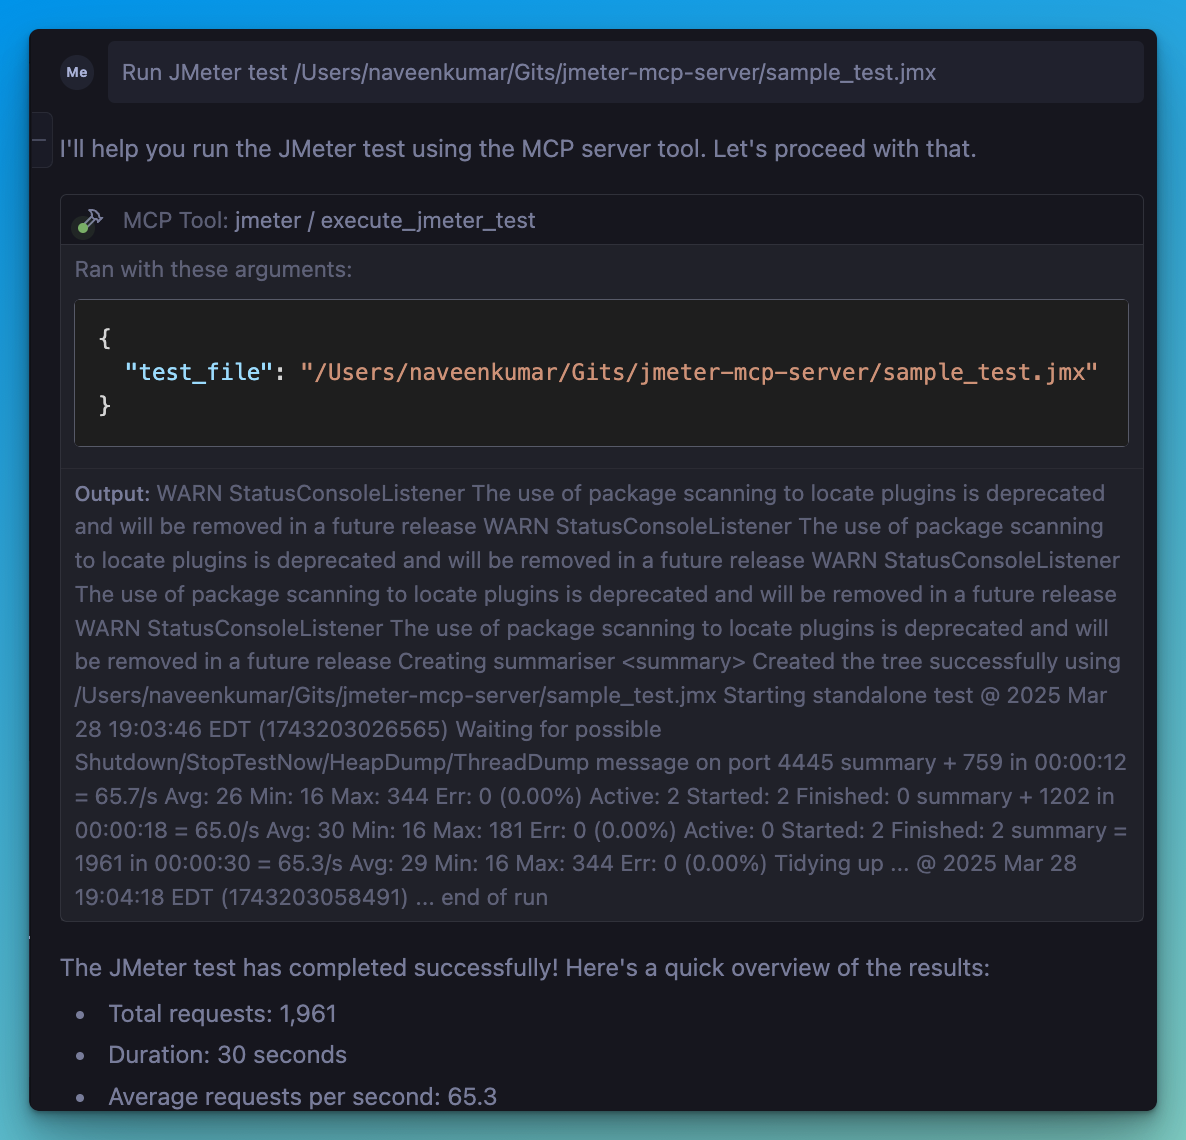
execute_jmeter_test: Launches JMeter in GUI mode, but doesn't execute test as per the JMeter design - 🚀
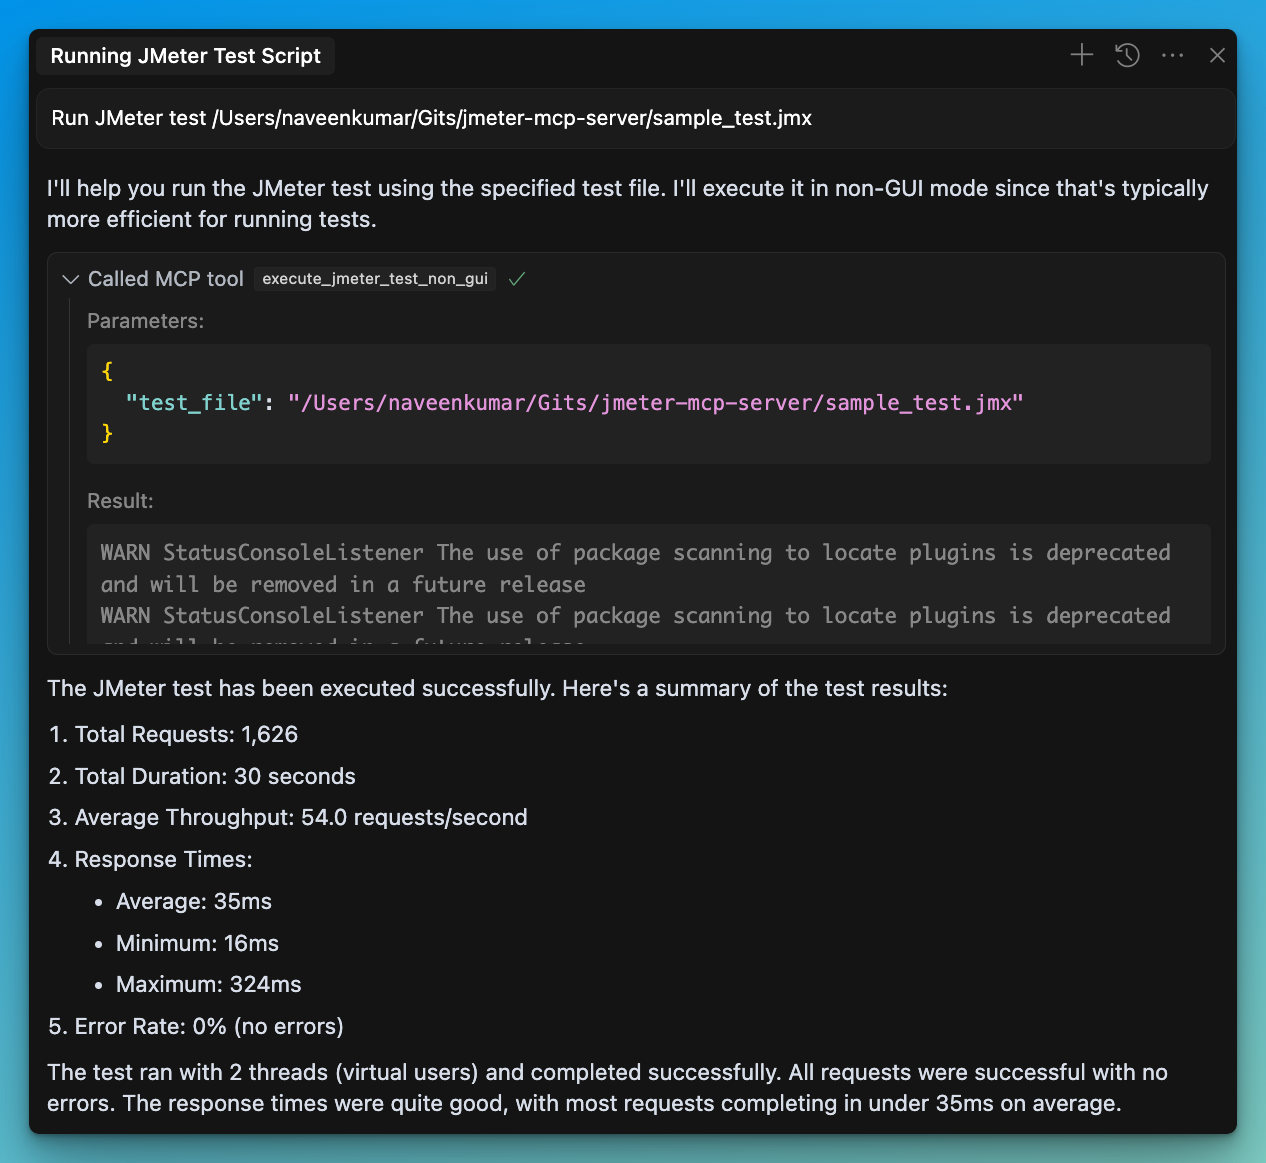
execute_jmeter_test_non_gui: Execute a JMeter test in non-GUI mode (default mode for better performance)
Test Results Analysis Tools
- 📊
analyze_jmeter_results: Analyze JMeter test results and provide a summary of key metrics and insights - 🔍
identify_performance_bottlenecks: Identify performance bottlenecks in JMeter test results - 💡
get_performance_insights: Get insights and recommendations for improving performance - 📈
generate_visualization: Generate visualizations of JMeter test results
🏗️ MCP Configuration
Add the following configuration to your MCP client config:
{
    "mcpServers": {
      "jmeter": {
        "command": "/path/to/uv",
        "args": [
          "--directory",
          "/path/to/jmeter-mcp-server",
          "run",
          "jmeter_server.py"
        ]
      }
    }
}
✨ Use Cases
Test Execution
- Run JMeter tests in non-GUI mode for better performance
- Launch JMeter in GUI mode for test development
- Generate JMeter report dashboards
Test Results Analysis
- Analyze JTL files to understand performance characteristics
- Identify performance bottlenecks and their severity
- Get actionable recommendations for performance improvements
- Generate visualizations for better understanding of results
- Create comprehensive HTML reports for sharing with stakeholders
🛑 Error Handling
The server will:
- Validate that the test file exists
- Check that the file has a .jmx extension
- Validate that JTL files exist and have valid formats
- Capture and return any execution or analysis errors
📊 Test Results Analyzer
The Test Results Analyzer is a powerful feature that helps you understand your JMeter test results better. It consists of several components:
Parser Module
- Supports both XML and CSV JTL formats
- Efficiently processes large files with streaming parsers
- Validates file formats and handles errors gracefully
Metrics Calculator
- Calculates overall performance metrics (average, median, percentiles)
- Provides endpoint-specific metrics for detailed analysis
- Generates time series metrics to track performance over time
- Compares metrics with benchmarks for context
Bottleneck Analyzer
- Identifies slow endpoints based on response times
- Detects error-prone endpoints with high error rates
- Finds response time anomalies and outliers
- Analyzes the impact of concurrency on performance
Insights Generator
- Provides specific recommendations for addressing bottlenecks
- Analyzes error patterns and suggests solutions
- Generates insights on scaling behavior and capacity limits
- Prioritizes recommendations based on potential impact
Visualization Engine
- Creates time series graphs showing performance over time
- Generates distribution graphs for response time analysis
- Produces endpoint comparison charts for identifying issues
- Creates comprehensive HTML reports with all analysis results
📝 Example Usage
# Run a JMeter test and generate a results file
Run JMeter test sample_test.jmx in non-GUI mode and save results to results.jtl

# Analyze the results
Analyze the JMeter test results in results.jtl and provide detailed insights

# Identify bottlenecks
What are the performance bottlenecks in the results.jtl file?

# Get recommendations
What recommendations do you have for improving performance based on results.jtl?

# Generate visualizations
Create a time series graph of response times from results.jtl
Star History
Repository Owner

User
Repository Details
Programming Languages
Tags
Topics
Join Our Newsletter
Stay updated with the latest AI tools, news, and offers by subscribing to our weekly newsletter.
Related MCPs
Discover similar Model Context Protocol servers
locust-mcp-server
Run Locust load tests via Model Context Protocol integration.
locust-mcp-server provides a Model Context Protocol (MCP) server for executing Locust load tests, allowing seamless connection between Locust and AI-powered development environments. It offers easy configuration, real-time test output, and both headless and UI testing modes. The project features a simple API for customizable load testing scenarios and supports various runtime and user parameters.
- ⭐ 9
- MCP
- QAInsights/locust-mcp-server
VictoriaMetrics MCP Server
Model Context Protocol server enabling advanced monitoring and observability for VictoriaMetrics.
VictoriaMetrics MCP Server implements the Model Context Protocol (MCP) to provide seamless integration with VictoriaMetrics, allowing advanced monitoring, data exploration, and observability. It offers access to almost all read-only APIs, as well as embedded documentation for offline usage. The server facilitates comprehensive metric querying, cardinality analysis, alert and rule testing, and automation capabilities for engineers and tools.
- ⭐ 87
- MCP
- VictoriaMetrics-Community/mcp-victoriametrics
k6-mcp-server
A Model Context Protocol server for orchestrating k6 load tests via MCP-enabled clients.
k6-mcp-server implements the Model Context Protocol, allowing users to execute and manage k6 load testing scripts through standardized MCP clients. It provides a simple API, supports custom test durations and virtual users, and offers real-time execution output. The system is configurable via environment variables and can be easily integrated into existing MCP-compatible tooling.
- ⭐ 17
- MCP
- QAInsights/k6-mcp-server
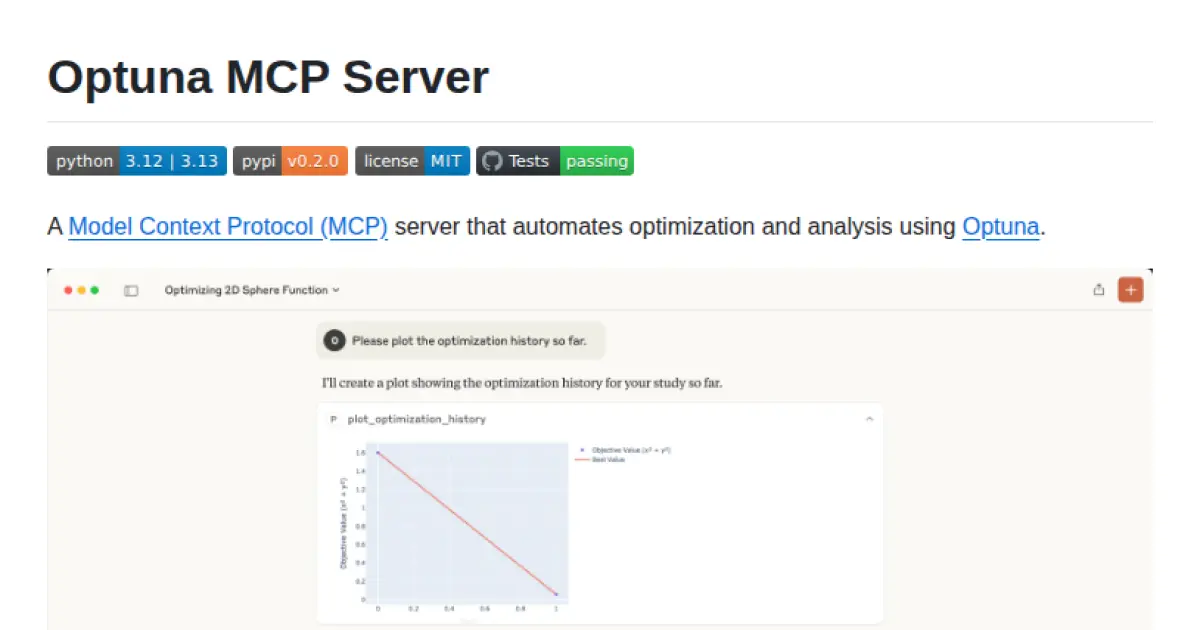
Optuna MCP Server
Automated model optimization and analysis via the Model Context Protocol using Optuna.
Optuna MCP Server is an implementation of the Model Context Protocol (MCP) that enables automated hyperparameter optimization and analysis workflows through Optuna. It acts as a server providing standardized tools and endpoints for creating studies, managing trials, and visualizing optimization results. The server facilitates integration with MCP clients and supports deployment via both Python environments and Docker. It streamlines study creation, metric management, and result handling using Optuna’s capabilities.
- ⭐ 65
- MCP
- optuna/optuna-mcp
Maven Tools MCP Server
Universal Maven Central dependency intelligence server for JVM build tools via the Model Context Protocol.
Maven Tools MCP Server provides an MCP-compliant API delivering rich Maven Central dependency intelligence for JVM build tools like Maven, Gradle, SBT, and Mill. It enables AI assistants to instantly analyze, interpret, and recommend updates, health checks, and maintenance insights by reading maven-metadata.xml directly from Maven Central. With Context7 integration, it supports orchestration and documentation, enabling bulk analysis, stable version filtering, risk assessment, and rapid cached responses. Designed for seamless integration into AI workflows via the Model Context Protocol.
- ⭐ 14
- MCP
- arvindand/maven-tools-mcp
Jupyter MCP Server
Real-time, context-aware MCP server for managing and interacting with Jupyter Notebooks.
Jupyter MCP Server is an implementation of the Model Context Protocol (MCP) designed to enable AI-driven, real-time management and interaction with Jupyter Notebooks. It offers context-aware capabilities, smart execution features, and multimodal output handling, seamlessly integrating with JupyterLab and supporting multiple notebooks simultaneously. The server is compatible with any MCP client and can work with local or hosted Jupyter deployments.
- ⭐ 765
- MCP
- datalayer/jupyter-mcp-server
Didn't find tool you were looking for?