MacOS Resource Monitor MCP Server
Lightweight MCP server for monitoring CPU, memory, and network usage on macOS.
Key Features
Use Cases
README
MacOS Resource Monitor MCP Server
A Model Context Protocol (MCP) server that identifies resource-intensive processes on macOS across CPU, memory, and network usage.
Overview
MacOS Resource Monitor is a lightweight MCP server that exposes an MCP endpoint for monitoring system resources. It analyzes CPU, memory, and network usage, and identifies the most resource-intensive processes on your Mac, returning data in a structured JSON format.
Requirements
- macOS operating system
- Python 3.10+
- MCP server library
Installation
Option 1: Global Installation (Recommended)
Install the MCP server globally using uv for system-wide access:
git clone https://github.com/Pratyay/mac-monitor-mcp.git
cd mac-monitor-mcp
uv tool install .
Now you can run the server from anywhere:
mac-monitor
Option 2: Development Installation
-
Clone this repository:
bashgit clone https://github.com/Pratyay/mac-monitor-mcp.git cd mac-monitor-mcp -
Create a virtual environment (recommended):
bashpython -m venv venv source venv/bin/activate -
Install the required dependencies:
bashpip install mcp
Usage
Global Installation
If you installed globally with uv:
mac-monitor
Development Installation
If you're running from the project directory:
python src/mac_monitor/monitor.py
Or using uv run (from project directory):
uv run mac-monitor
You should see the message:
Simple MacOS Resource Monitor MCP server starting...
Monitoring CPU, Memory, and Network resource usage...
The server will start and expose the MCP endpoint, which can be accessed by an LLM or other client.
Available Tools
The server exposes three tools:
1. get_resource_intensive_processes()
Returns information about the top 5 most resource-intensive processes in each category (CPU, memory, and network).
2. get_processes_by_category(process_type, page=1, page_size=10, sort_by="auto", sort_order="desc")
Returns all processes in a specific category with advanced filtering, pagination, and sorting options.
Parameters:
process_type:"cpu","memory", or"network"page: Page number (starting from 1, default: 1)page_size: Number of processes per page (default: 10, max: 100)sort_by: Sort field -"auto"(default metric),"pid","command", or category-specific fields:- CPU:
"cpu_percent","pid","command" - Memory:
"memory_percent","resident_memory_kb","pid","command" - Network:
"network_connections","pid","command"
- CPU:
sort_order:"desc"(default) or"asc"
Example Usage:
# Get first page of CPU processes (default: sorted by CPU% descending)
get_processes_by_category("cpu")

# Get memory processes sorted by resident memory, highest first
get_processes_by_category("memory", sort_by="resident_memory_kb", sort_order="desc")

# Get network processes sorted by command name A-Z, page 2
get_processes_by_category("network", page=2, sort_by="command", sort_order="asc")

# Get 20 CPU processes per page, sorted by PID ascending
get_processes_by_category("cpu", page_size=20, sort_by="pid", sort_order="asc")
3. get_system_overview()
Returns comprehensive system overview with aggregate statistics similar to Activity Monitor. Provides CPU, memory, disk, network statistics, and intelligent performance analysis to help identify bottlenecks and optimization opportunities.
Features:
- CPU Metrics: Usage percentages, load averages, core count
- Memory Analysis: Total/used/free memory with percentages
- Disk Statistics: Storage usage across all filesystems
- Network Overview: Active connections, interface statistics
- Performance Analysis: Intelligent bottleneck detection and recommendations
- System Information: macOS version, uptime, process count
Example Usage:
get_system_overview() # Get comprehensive system overview
Use Cases:
- System performance monitoring and analysis
- Identifying performance bottlenecks and slowdowns
- Resource usage trending and capacity planning
- Troubleshooting system performance issues
- Getting quick system health overview
Sample Output
get_resource_intensive_processes() Output
{
  "cpu_intensive_processes": [
    {
      "pid": "1234",
      "cpu_percent": 45.2,
      "command": "firefox"
    },
    {
      "pid": "5678",
      "cpu_percent": 32.1,
      "command": "Chrome"
    }
  ],
  "memory_intensive_processes": [
    {
      "pid": "1234",
      "memory_percent": 8.5,
      "resident_memory_kb": 1048576,
      "command": "firefox"
    },
    {
      "pid": "8901",
      "memory_percent": 6.2,
      "resident_memory_kb": 768432,
      "command": "Docker"
    }
  ],
  "network_intensive_processes": [
    {
      "command": "Dropbox",
      "network_connections": 12
    },
    {
      "command": "Spotify",
      "network_connections": 8
    }
  ]
}
get_processes_by_category() Output
{
  "process_type": "cpu",
  "processes": [
    {
      "pid": "1234",
      "cpu_percent": 45.2,
      "command": "firefox"
    },
    {
      "pid": "5678",
      "cpu_percent": 32.1,
      "command": "Chrome"
    }
  ],
  "sorting": {
    "sort_by": "cpu_percent",
    "sort_order": "desc",
    "requested_sort_by": "auto"
  },
  "pagination": {
    "current_page": 1,
    "page_size": 10,
    "total_processes": 156,
    "total_pages": 16,
    "has_next_page": true,
    "has_previous_page": false
  }
}
How It Works
The MacOS Resource Monitor uses built-in macOS command-line utilities:
ps: To identify top CPU and memory consuming processeslsof: To monitor network connections and identify network-intensive processes
Data is collected when the tool is invoked, providing a real-time snapshot of system resource usage.
Integration with LLMs
This MCP server is designed to work with Large Language Models (LLMs) that support the Model Context Protocol. The LLM can use the get_resource_intensive_processes tool to access system resource information and provide intelligent analysis.
Contributing
Contributions are welcome! Please feel free to submit a Pull Request.
- Fork the repository
- Create your feature branch (
git checkout -b feature/amazing-feature) - Commit your changes (
git commit -m 'Add some amazing feature') - Push to the branch (
git push origin feature/amazing-feature) - Open a Pull Request
Management Commands
If you installed the server globally with uv:
- List installed tools:
uv tool list - Uninstall:
uv tool uninstall mac-monitor - Upgrade:
uv tool install --force .(from project directory) - Install from Git:
uv tool install git+https://github.com/Pratyay/mac-monitor-mcp.git
Recent Updates
Version 0.2.0 (Latest)
- ✅ Added
get_processes_by_category()tool with pagination and sorting - ✅ Added comprehensive sorting options (CPU%, memory, PID, command name)
- ✅ Added proper Python packaging with
pyproject.toml - ✅ Added global installation support via
uv tool install - ✅ Enhanced error handling and input validation
- ✅ Added pagination metadata with navigation information
Potential Improvements
Here are some ways you could enhance this monitor:
- Add disk I/O monitoring
- Improve network usage monitoring to include bandwidth
- Add visualization capabilities
- Extend compatibility to other operating systems
- Add process filtering by resource thresholds
- Add historical data tracking and trends
Star History
Repository Owner

User
Repository Details
Programming Languages
Tags
Join Our Newsletter
Stay updated with the latest AI tools, news, and offers by subscribing to our weekly newsletter.
Related MCPs
Discover similar Model Context Protocol servers
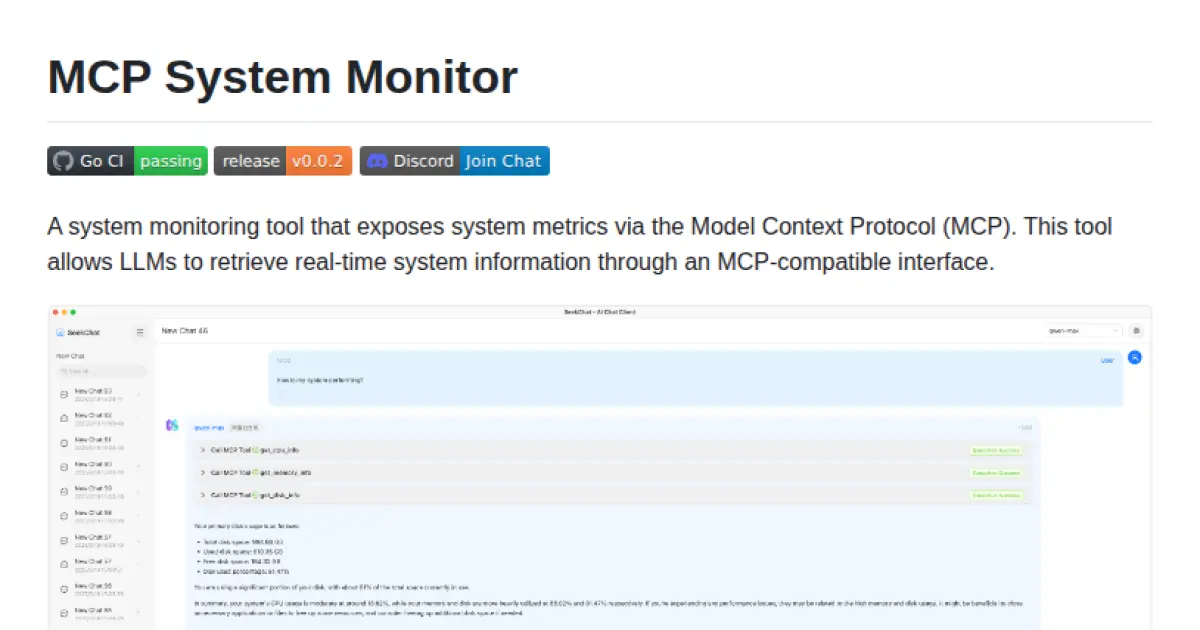
MCP System Monitor
Real-time system metrics for LLMs via Model Context Protocol
MCP System Monitor exposes real-time system metrics, such as CPU, memory, disk, network, host, and process information, through an interface compatible with the Model Context Protocol (MCP). The tool enables language models to retrieve detailed system data in a standardized way. It supports querying various hardware and OS statistics via structured tools and parameters. Designed with LLM integration in mind, it facilitates context-aware system monitoring for AI-driven applications.
- ⭐ 73
- MCP
- seekrays/mcp-monitor
JVM MCP Server
Lightweight multi-agent protocol server for JVM monitoring and diagnostics.
JVM MCP Server provides a lightweight, zero-dependency server that implements the Multi-Agent Communication Protocol for monitoring and diagnosing Java applications. It leverages native JDK tools to enable powerful AI agent interactions for gathering JVM metrics, analyzing memory and threads, and performing advanced diagnostics without relying on third-party software. The server supports both local and remote Java environments through SSH, ensuring cross-platform compatibility and secure operation.
- ⭐ 71
- MCP
- xzq-xu/jvm-mcp-server
Mac Apps Launcher MCP Server
Launch and manage macOS applications via an MCP server.
Mac Apps Launcher MCP Server enables the listing, launching, and management of macOS applications through the Model Context Protocol. Designed to integrate with systems supporting MCP, it provides standardized methods to enumerate app folders, launch apps by name, and open files with specified applications. Configuration details are provided for integration with Claude Config JSON.
- ⭐ 16
- MCP
- JoshuaRileyDev/mac-apps-launcher
Everything Search MCP Server
Fast, cross-platform file search via Model Context Protocol integration.
Everything Search MCP Server provides fast file and folder search capabilities across Windows, macOS, and Linux platforms as an MCP server. It leverages native search utilities such as the Everything SDK on Windows, mdfind on macOS, and locate/plocate on Linux. The tool exposes a standardized search interface with customizable parameters including query, sorting, and matching options. It is suitable for integration with AI clients or automation tools that follow the Model Context Protocol.
- ⭐ 268
- MCP
- mamertofabian/mcp-everything-search
Homebrew MCP Python Server
Expose Homebrew management as MCP tools for integration with AI clients.
Homebrew MCP Python Server provides an MCP-compliant interface to manage Homebrew packages on macOS via a Python-based server. It enables standardized control of Homebrew commands through the Model Context Protocol, supporting integration with Claude Desktop, Cursor, and other MCP-compatible clients. The server operates via stdio using JSON-RPC 2.0, logs all interactions, and offers a declarative Python implementation. It is designed for seamless tool-chaining, advanced context management, and easy integration into LLM-driven environments.
- ⭐ 18
- MCP
- jeannier/homebrew-mcp
JMeter MCP Server
Execute and analyze JMeter tests via Model Context Protocol integration.
JMeter MCP Server enables execution and analysis of Apache JMeter tests through MCP-compatible clients. It provides command-line and programmatic tools for running JMeter tests in GUI and non-GUI modes, parsing and analyzing JTL result files, and generating detailed metrics and reports. Designed for integration with tools that follow the Model Context Protocol, it facilitates seamless performance testing workflows and actionable insights for test results.
- ⭐ 47
- MCP
- QAInsights/jmeter-mcp-server
Didn't find tool you were looking for?