MCP Server Chart
A Model Context Protocol server for generating and analyzing charts using AntV.
Key Features
Use Cases
README
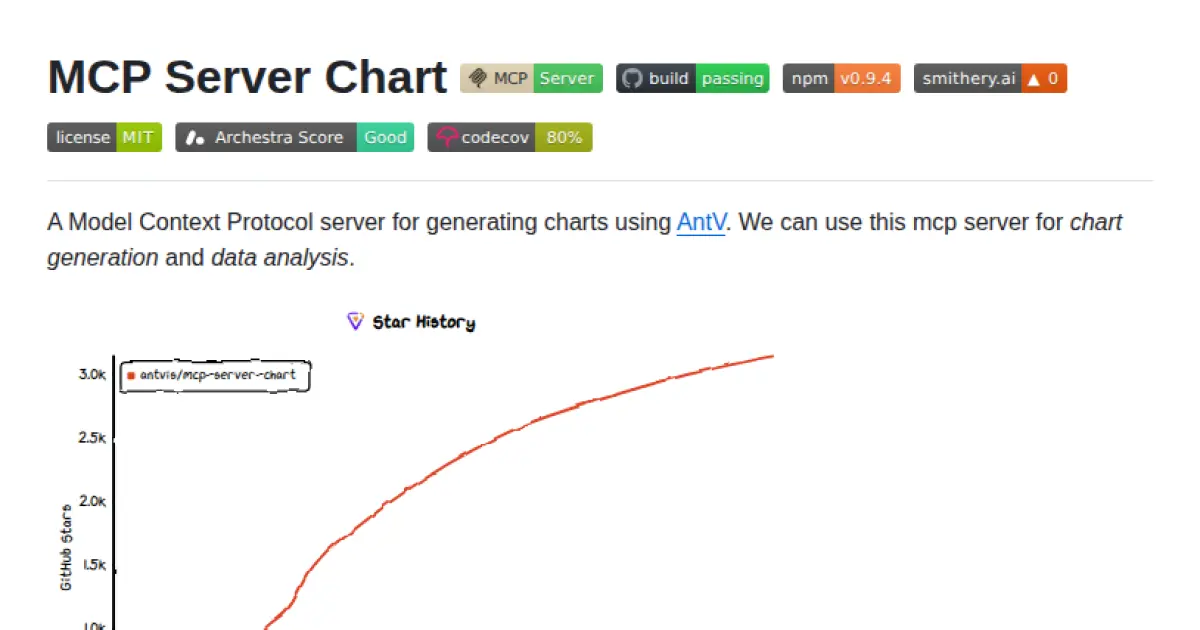
MCP Server Chart 


A Model Context Protocol server for generating charts using AntV. We can use this mcp server for chart generation and data analysis.
This is a TypeScript-based MCP server that provides chart generation capabilities. It allows you to create various types of charts through MCP tools. You can also use it in Dify.
📋 Table of Contents
- ✨ Features
- 🤖 Usage
- 🚰 Run with SSE or Streamable transport
- 🎮 CLI Options
- ⚙️ Environment Variables
- VIS_REQUEST_SERVER
- SERVICE_ID
- DISABLED_TOOLS
- 📠 Private Deployment
- 🗺️ Generate Records
- 🎛️ Tool Filtering
- 🔨 Development
- 📄 License
✨ Features
Now 25+ charts supported.
generate_area_chart: Generate anareachart, used to display the trend of data under a continuous independent variable, allowing observation of overall data trends.generate_bar_chart: Generate abarchart, used to compare values across different categories, suitable for horizontal comparisons.generate_boxplot_chart: Generate aboxplot, used to display the distribution of data, including the median, quartiles, and outliers.generate_column_chart: Generate acolumnchart, used to compare values across different categories, suitable for vertical comparisons.generate_district_map- Generate adistrict-map, used to show administrative divisions and data distribution.generate_dual_axes_chart: Generate adual-axeschart, used to display the relationship between two variables with different units or ranges.generate_fishbone_diagram: Generate afishbonediagram, also known as an Ishikawa diagram, used to identify and display the root causes of a problem.generate_flow_diagram: Generate aflowchart, used to display the steps and sequence of a process.generate_funnel_chart: Generate afunnelchart, used to display data loss at different stages.generate_histogram_chart: Generate ahistogram, used to display the distribution of data by dividing it into intervals and counting the number of data points in each interval.generate_line_chart: Generate alinechart, used to display the trend of data over time or another continuous variable.generate_liquid_chart: Generate aliquidchart, used to display the proportion of data, visually representing percentages in the form of water-filled spheres.generate_mind_map: Generate amind-map, used to display thought processes and hierarchical information.generate_network_graph: Generate anetworkgraph, used to display relationships and connections between nodes.generate_organization_chart: Generate anorganizationalchart, used to display the structure of an organization and personnel relationships.generate_path_map- Generate apath-map, used to display route planning results for POIs.generate_pie_chart: Generate apiechart, used to display the proportion of data, dividing it into parts represented by sectors showing the percentage of each part.generate_pin_map- Generate apin-map, used to show the distribution of POIs.generate_radar_chart: Generate aradarchart, used to display multi-dimensional data comprehensively, showing multiple dimensions in a radar-like format.generate_sankey_chart: Generate asankeychart, used to display data flow and volume, representing the movement of data between different nodes in a Sankey-style format.generate_scatter_chart: Generate ascatterplot, used to display the relationship between two variables, showing data points as scattered dots on a coordinate system.generate_treemap_chart: Generate atreemap, used to display hierarchical data, showing data in rectangular forms where the size of rectangles represents the value of the data.generate_venn_chart: Generate avenndiagram, used to display relationships between sets, including intersections, unions, and differences.generate_violin_chart: Generate aviolinplot, used to display the distribution of data, combining features of boxplots and density plots to provide a more detailed view of the data distribution.generate_word_cloud_chart: Generate aword-cloud, used to display the frequency of words in textual data, with font sizes indicating the frequency of each word.
[!NOTE] The above geographic visualization chart generation tool uses AMap service and currently only supports map generation within China.
🤖 Usage
To use with Desktop APP, such as Claude, VSCode, Cline, Cherry Studio, Cursor, and so on, add the MCP server config below. On Mac system:
{
  "mcpServers": {
    "mcp-server-chart": {
      "command": "npx",
      "args": ["-y", "@antv/mcp-server-chart"]
    }
  }
}
On Window system:
{
  "mcpServers": {
    "mcp-server-chart": {
      "command": "cmd",
      "args": ["/c", "npx", "-y", "@antv/mcp-server-chart"]
    }
  }
}
Also, you can use it on aliyun, modelscope, glama.ai, smithery.ai or others with HTTP, SSE Protocol.
🚰 Run with SSE or Streamable transport
Run directly
Install the package globally.
npm install -g @antv/mcp-server-chart
Run the server with your preferred transport option:
# For SSE transport (default endpoint: /sse)
mcp-server-chart --transport sse

# For Streamable transport with custom endpoint
mcp-server-chart --transport streamable
Then you can access the server at:
- SSE transport:
http://localhost:1122/sse - Streamable transport:
http://localhost:1122/mcp
Docker deploy
Enter the docker directory.
cd docker
Deploy using docker-compose.
docker compose up -d
Then you can access the server at:
- SSE transport:
http://localhost:1123/sse - Streamable transport:
http://localhost:1122/mcp
🎮 CLI Options
You can also use the following CLI options when running the MCP server. Command options by run cli with -H.
MCP Server Chart CLI

Options:
  --transport, -t  Specify the transport protocol: "stdio", "sse", or "streamable" (default: "stdio")
  --host, -h       Specify the host for SSE or streamable transport (default: localhost)
  --port, -p       Specify the port for SSE or streamable transport (default: 1122)
  --endpoint, -e   Specify the endpoint for the transport:
                   - For SSE: default is "/sse"
                   - For streamable: default is "/mcp"
  --help, -H       Show this help message
⚙️ Environment Variables
| Variable | Description | Default | Example |
|---|---|---|---|
VIS_REQUEST_SERVER |
Custom chart generation service URL for private deployment | https://antv-studio.alipay.com/api/gpt-vis |
https://your-server.com/api/chart |
SERVICE_ID |
Service identifier for chart generation records | - | your-service-id-123 |
DISABLED_TOOLS |
Comma-separated list of tool names to disable | - | generate_fishbone_diagram,generate_mind_map |
📠 Private Deployment
MCP Server Chart provides a free chart generation service by default. For users with a need for private deployment, they can try using VIS_REQUEST_SERVER to customize their own chart generation service.
{
  "mcpServers": {
    "mcp-server-chart": {
      "command": "npx",
      "args": ["-y", "@antv/mcp-server-chart"],
      "env": {
        "VIS_REQUEST_SERVER": "<YOUR_VIS_REQUEST_SERVER>"
      }
    }
  }
}
You can use AntV's project GPT-Vis-SSR to deploy an HTTP service in a private environment, and then pass the URL address through env VIS_REQUEST_SERVER.
- Method:
POST - Parameter: Which will be passed to
GPT-Vis-SSRfor rendering. Such as,{ "type": "line", "data": [{ "time": "2025-05", "value": 512 }, { "time": "2025-06", "value": 1024 }] }. - Return: The return object of HTTP service.
- success:
booleanWhether generate chart image successfully. - resultObj:
stringThe chart image url. - errorMessage:
stringWhensuccess = false, return the error message.
- success:
[!NOTE] The private deployment solution currently does not support geographic visualization chart generation include 3 tools:
geographic-district-map,geographic-path-map,geographic-pin-map.
🗺️ Generate Records
By default, users are required to save the results themselves, but we also provide a service for viewing the chart generation records, which requires users to generate a service identifier for themselves and configure it.
Use Alipay to scan and open the mini program to generate a personal service identifier (click the "My" menu below, enter the "My Services" page, click the "Generate" button, and click the "Copy" button after success):
Next, you need to add the SERVICE_ID environment variable to the MCP server configuration. For example, the configuration for Mac is as follows (for Windows systems, just add the env variable):
{
  "mcpServers": {
    "AntV Map": {
      "command": "npx",
      "args": ["-y", "@antv/mcp-server-chart"],
      "env": {
        "SERVICE_ID": "***********************************"
      }
    }
  }
}
After updating the MCP Server configuration, you need to restart your AI client application and check again whether you have started and connected to the MCP Server successfully. Then you can try to generate the map again. After the generation is successful, you can go to the "My Map" page of the mini program to view your map generation records.
🎛️ Tool Filtering
You can disable specific chart generation tools using the DISABLED_TOOLS environment variable. This is useful when certain tools have compatibility issues with your MCP client or when you want to limit the available functionality.
{
  "mcpServers": {
    "mcp-server-chart": {
      "command": "npx",
      "args": ["-y", "@antv/mcp-server-chart"],
      "env": {
        "DISABLED_TOOLS": "generate_fishbone_diagram,generate_mind_map"
      }
    }
  }
}
Available tool names for filtering See the ✨ Features.
🔨 Development
Install dependencies:
npm install
Build the server:
npm run build
Start the MCP server:
npm run start
Start the MCP server with SSE transport:
node build/index.js -t sse
Start the MCP server with Streamable transport:
node build/index.js -t streamable
📄 License
MIT@AntV.
Star History
Repository Owner

Organization
Repository Details
Programming Languages
Tags
Topics
Join Our Newsletter
Stay updated with the latest AI tools, news, and offers by subscribing to our weekly newsletter.
Related MCPs
Discover similar Model Context Protocol servers
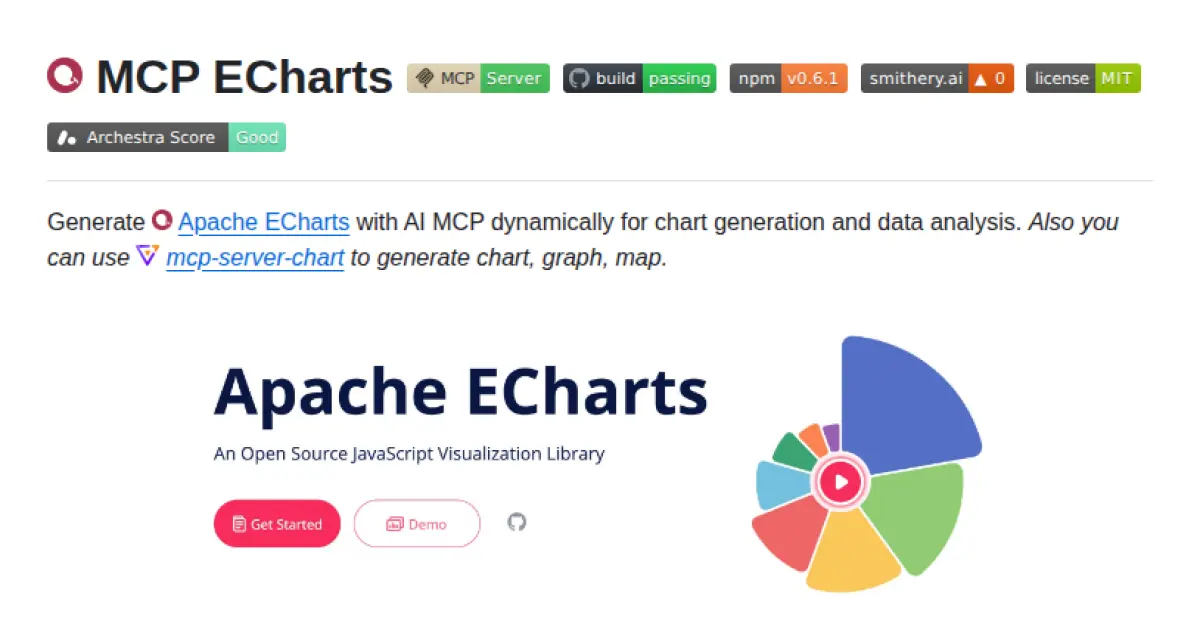
MCP ECharts
Dynamically generate Apache ECharts visualizations via Model Context Protocol (MCP).
MCP ECharts enables dynamic generation of Apache ECharts visualizations through the Model Context Protocol, supporting interactions with AI models. It provides multiple transport options (stdio, SSE, streamable) and integrates with platforms like Claude, VSCode, and Smithery. The tool allows exporting charts in PNG, SVG, and option formats, with optional MinIO storage for enhanced sharing and performance. Featuring zero dependencies and local secure rendering, it is easily deployable and versatile for a range of visualization workflows.
- ⭐ 153
- MCP
- hustcc/mcp-echarts
Data Visualization MCP Server
MCP server for data visualization using Vega-Lite.
Data Visualization MCP Server enables large language models to visualize data through a standardized interface using Vega-Lite specifications. The server provides tools for saving data tables and generating visualizations as text or PNG images. Integration with platforms like Claude Desktop allows seamless addition of data visualization capabilities to LLM workflows.
- ⭐ 92
- MCP
- isaacwasserman/mcp-vegalite-server
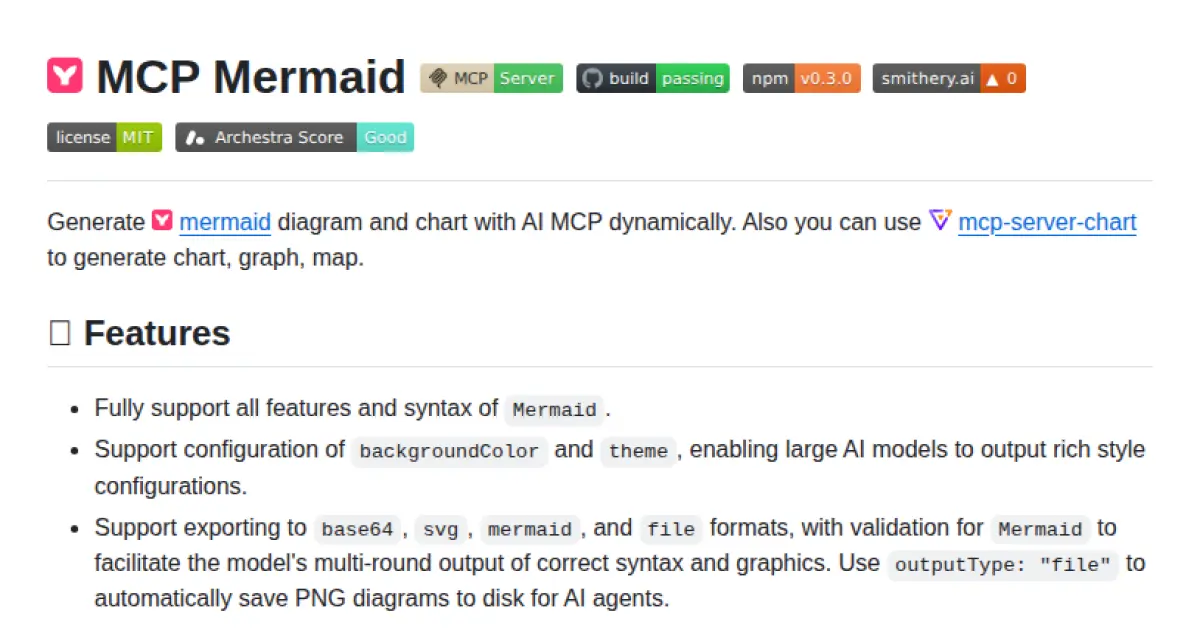
MCP Mermaid
AI-powered dynamic generation of Mermaid diagrams via the Model Context Protocol.
MCP Mermaid enables dynamic generation of Mermaid diagrams and charts using AI via the Model Context Protocol (MCP). It supports all features and syntax of Mermaid, and can export diagrams in various formats including SVG, base64, and files. The server can be run locally or globally using different transport protocols such as stdio, SSE, or streamable, making it compatible with tools like Claude, VSCode, and Smithery. It provides customization for background color and theme, and validates output to ensure correct syntax and graphics.
- ⭐ 283
- MCP
- hustcc/mcp-mermaid
Qlik MCP Server
Connect Claude AI to Qlik Cloud applications and extract insights via the Model Context Protocol.
Qlik MCP Server enables integration between Claude AI and Qlik Cloud applications through the Model Context Protocol (MCP). It exposes API tools for listing Qlik apps, retrieving sheets and charts, and extracting chart data programmatically. The server supports deployment via Docker, Deno, or Node.js, and can be configured for use with tools like Claude Desktop and Cursor. The setup emphasizes secure handling of Qlik Cloud credentials and flexible environment configuration.
- ⭐ 7
- MCP
- jwaxman19/qlik-mcp
Mindmap MCP Server
Convert Markdown content into interactive mindmaps via an MCP-compliant server.
Mindmap MCP Server provides a Model Context Protocol (MCP) compatible service that transforms Markdown input into interactive mindmap visualizations. It supports command-line, Python, and Docker installation methods for flexibility across platforms. Designed to integrate with MCP clients like Claude Desktop, it ensures seamless Markdown-to-mindmap conversion using markmap under the hood. The server is intended for easy plug-and-play use in model-powered workflows that require structured, visual context formatting.
- ⭐ 205
- MCP
- YuChenSSR/mindmap-mcp-server
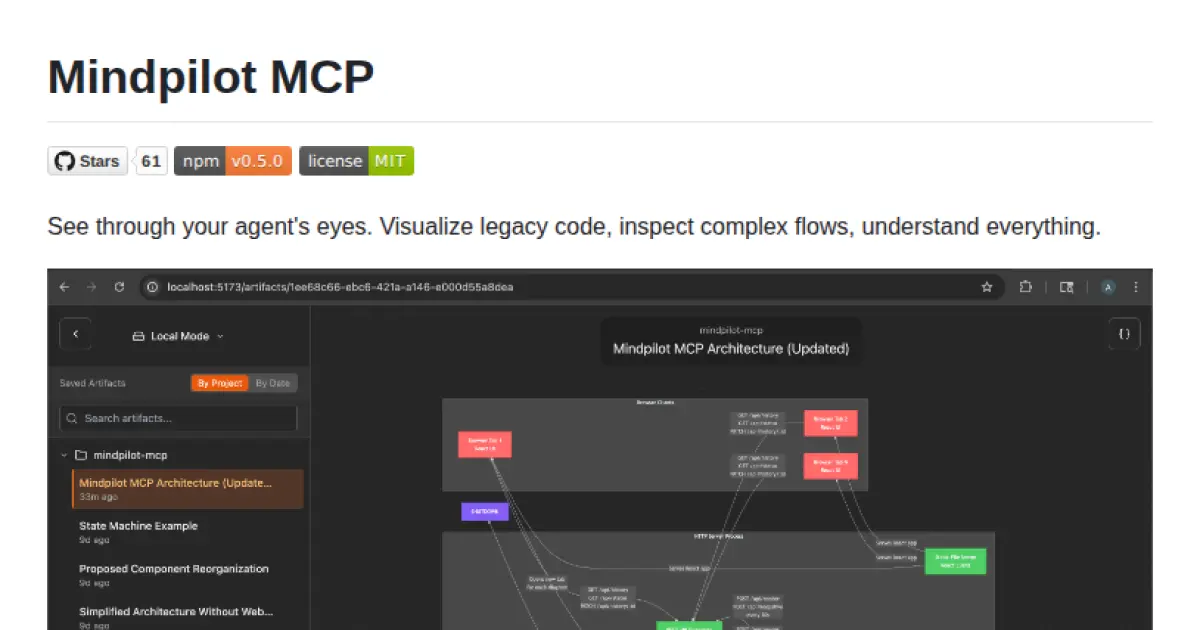
Mindpilot MCP
Visualize and understand code structures with on-demand diagrams for AI coding assistants.
Mindpilot MCP provides AI coding agents with the capability to visualize, analyze, and understand complex codebases through interactive diagrams. It operates as a Model Context Protocol (MCP) server, enabling seamless integration with multiple development environments such as VS Code, Cursor, Windsurf, Zed, and Claude Code. Mindpilot ensures local processing for privacy, supports multi-client connections, and offers robust configuration options for server operation and data management. Users can export diagrams and adjust analytics settings for improved user control.
- ⭐ 61
- MCP
- abrinsmead/mindpilot-mcp
Didn't find tool you were looking for?