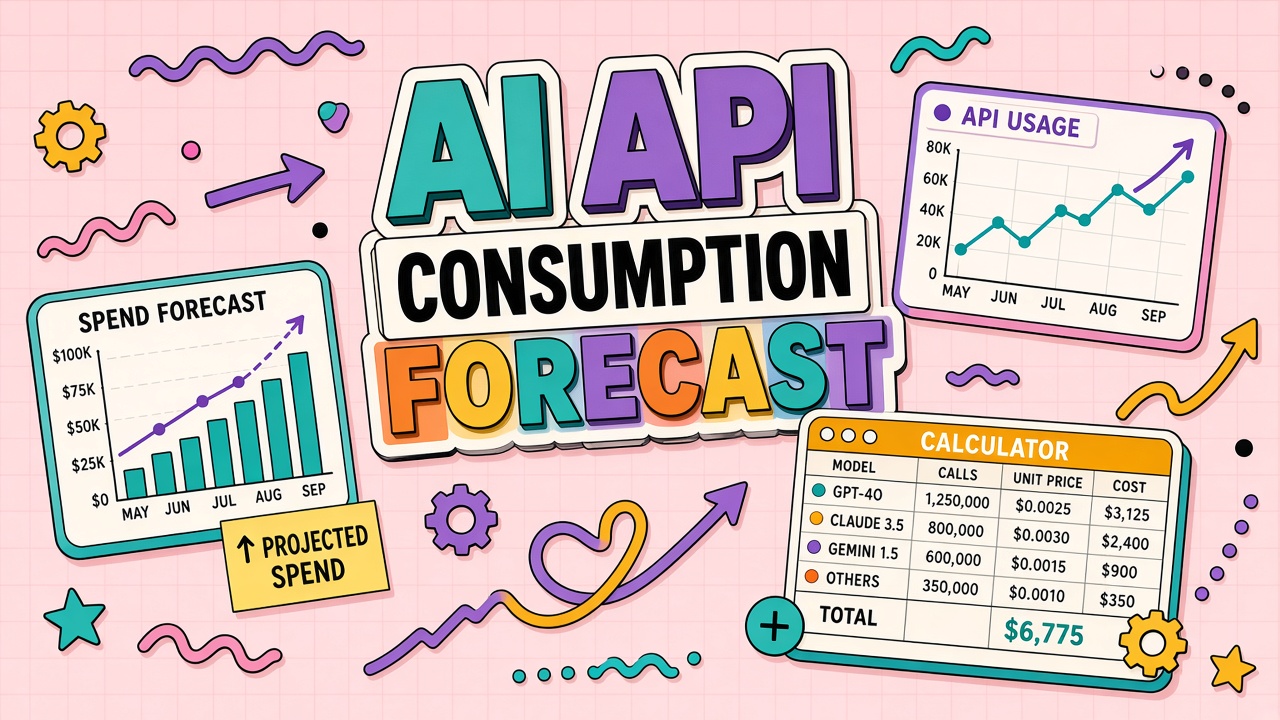
Finance asks for next quarter's AI budget. Engineering exports last month's token CSV and guesses. The forecast misses a product launch, a model price change, and holiday traffic patterns. A disciplined ai api consumption forecast turns usage history into defensible projections finance can approve.
Spreadsheets remain the lingua franca between engineering, product, and finance. This guide describes column structure, assumptions, variance analysis, and alert thresholds. Teams scaling AI productivity tools and private AI chatbots should rebuild forecasts monthly until usage stabilizes.
Inputs: Users, Tasks per Day, and Tokens per Task
Start with active users, average tasks per user per day, and median tokens per task. Separate interactive chat from batch jobs; batch often dominates token volume with fewer users.
Pull twelve weeks of history from vendor dashboards or billing exports. Use median and p95 tokens per task. Budget to p95 or p99 if SLA requires headroom for large documents.
Segment by model tier. Premium models multiply cost even when task counts stay flat. Tag API keys by product feature so growth in one feature does not hide in org-wide averages.
Document unit definitions: what counts as a task (one API call, one user message, one generated image). Mixed definitions break forecasts when teams compare notes.
Seasonality and Growth Assumptions
Apply seasonality multipliers for retail peaks, fiscal year-end reporting, and summer vacation dips. Compare same month prior year if history exists; otherwise use analogous product traffic curves.
Growth assumptions should tie to roadmap: new seats, new features, marketing campaigns. Each initiative gets a row with expected user delta and tasks per user uplift. Remove assumptions when initiatives slip.
Document confidence level (low, medium, high) per assumption row. Finance can scenario-plan without treating a hopeful product launch as baseline truth.
Model Price Change Scenarios
Model unit economics change without warning. Build scenario tabs: base (current price list), plus ten percent token price increase, and migration to a cheaper model with quality tradeoff notes.
Link price cells to vendor documentation URLs and effective dates. When vendors announce deprecations, model forced migration cost separately from organic growth.
Include cached token discounts and batch API rates if your architecture uses them. Forecasting at full list price overstates spend for optimized pipelines.
| Column | Formula / source |
|---|---|
| Active users | SSO or app analytics; growth % from roadmap |
| Tasks per user per day | Rolling 4-week median from logs |
| Tokens per task (p95) | Billing export grouped by feature tag |
| Monthly tokens | users × tasks × days × tokens × seasonality |
| Monthly cost | tokens × blended $/1M rate by model mix |
Alert Thresholds for Finance
Compare actuals to forecast weekly; alert when variance exceeds agreed bands (often ten to fifteen percent). Assign owner to explain variance: new feature, abuse, misconfigured retry loop, or wrong model routing.
Feed alerts into the same channels as infrastructure spend caps. Finance should see projected month-end burn based on week-to-date run rate, not only last month's invoice.
After major launches, switch to daily variance until usage plateaus. Forecast models lag reality during step-function adoption curves.
Worked Example: Support Bot Forecast
Consider a support squad with forty agents using an internal bot for draft replies. Historical data shows twenty-eight active users last month, four point two tasks per user per day on business days, and eighteen hundred median tokens per task on the primary model. At a blended rate of three dollars per million tokens, baseline monthly burn is roughly two hundred eighty dollars before seasonality.
Product plans to add twelve agents in Q2 and enable attachment summarization that raises p95 tokens to twenty-six hundred. The forecast adds users on hire dates, swaps median for p95 on the attachment feature row only, and applies a holiday multiplier of zero point eight five for the last two weeks of December. Finance sees base, growth, and stress tabs instead of one opaque total.
Variance Column Design
Add columns for forecast, actual, variance dollars, and variance percent. Color cells when variance exceeds ten percent. Require a comment field for any row over threshold before month close. Comments like "retry loop bug, fixed 3/12" turn spreadsheets into learning systems instead of blame documents.
Connecting Forecast to Token Usage Projection
Token usage projection fails when teams multiply last week by four and call it a month. Business days differ from calendar days. Batch jobs cluster on Sundays. Campaign traffic spikes mid-week. Build a daily grain tab, roll up to monthly, and only then apply seasonality. Daily grain also catches runaway jobs within the month instead of after invoice.
For multi-region teams, split users by timezone so "tasks per day" reflects local business hours rather than UTC artifacts. A European support desk and a US engineering team should not share one tasks-per-day assumption unless they truly share one workflow.
AI Consumption Model Governance
Name a forecast owner and reviewer. The owner updates assumptions weekly during rollouts; the reviewer from finance approves changes to price cells and growth multipliers. Version the spreadsheet in shared drive with date stamps. When leadership asks "why did Q2 forecast change," the answer should be a dated assumption row, not memory.
Building the Spreadsheet Tab Structure
Organize the workbook into tabs: Assumptions, Daily Grain, Monthly Rollup, Scenarios, Variance, and README. The README tab documents owner, refresh cadence, vendor export URLs, and definition of active user. Assumptions holds growth multipliers with effective dates and links to roadmap tickets. Daily Grain ingests raw exports so monthly formulas reference consistent ranges instead of hand-typed totals that drift.
Monthly Rollup applies seasonality and price cells to daily totals. Scenarios duplicate Monthly Rollup with altered price and adoption inputs. Variance compares Monthly Rollup forecast column to finance actuals. Keeping structure stable month to month matters more than exotic formulas. Finance learns one workbook shape and trusts it.
Forecast AI API Spend Review Meeting
Hold a thirty-minute monthly review with platform, finance, and top workflow owners. Agenda: variance over ten percent, assumption changes, upcoming launches, vendor price notices. Decisions log in README tab. Cancel meetings when variance is flat only after two consecutive clean months, not by default. Regular cadence prevents quarter-end panic when token usage projection diverged silently for ten weeks.
Token Usage Projection for Multi-Workflow Orgs
Large orgs rarely have one AI workflow. Build sub-rows per workflow: support bot, code review, marketing copy, internal search. Each row carries its own users, tasks, and tokens. Sum rows for org total. When one workflow pauses, zero its growth multiplier without touching stable rows. This prevents pausing a pilot from distorting forecast for mature production workflows that continue unchanged.
Operational Checklist
Assign a single owner for monthly refresh. Publish assumptions where finance and engineering both edit. Tie forecast or policy changes to ticket IDs. Review variance before month close, not after invoice payment. Run tabletop exercises when vendors announce pricing or deprecations. Keep archived exports for audit comparison quarter over quarter.
Document decisions in plain language any new hire can follow. Operational discipline matters as much as spreadsheet formulas or contract clauses. Teams that treat AI spend as unplannable noise get unplannable invoices. Teams that treat spend as a managed metric catch drift early and negotiate from data.
Cross-Functional Alignment
Platform owns technical tags and caps. Finance owns forecast and chargeback posting. Procurement owns contract language. Product owns workflow rollout dates that drive usage. Security owns trial data classification. Weekly five-minute sync during rollout quarters prevents each function optimizing locally while global spend drifts. Alignment is boring work that prevents exciting overage surprises.
Common Mistakes to Avoid
Mistake one: single org-wide average hiding squad spikes. Mistake two: ignoring human review labor in ROI or unit economics. Mistake three: annual commit sized on peak pilot week. Mistake four: alerts configured without owners. Mistake five: sunset without migration support. Mistake six: treating free tier as production. Mistake seven: streaming timeouts fixed by disabling streams without root cause. Mistake eight: duplicate responses patched in UI only while webhooks still double-write. Avoiding these patterns saves more than marginal token discounts.
Implementation Timeline
Week one: assign owners and export baseline data from vendor admin or application logs. Week two: draft spreadsheet, policy, or runbook sections relevant to your pillar. Week three: pilot with one squad and fix tagging or alert noise. Week four: publish org-wide with office hours. Month two: first variance or true-up review and adjust assumptions. Month three: executive summary with decisions made from metrics, not only spend totals.
Skipping the pilot week creates alert fatigue and mistrust in chargeback numbers. Investing four weeks upfront pays back when finance, security, and engineering reference the same artifacts instead of rebuilding from scratch each quarter. Treat this as operational infrastructure parallel to the AI features themselves.
Frequently Asked Questions
How do we forecast with multi-model routing?
Model mix percentage per feature row. Track routing rules in the spreadsheet assumptions. When router sends more traffic to premium models, cost rises faster than user counts.
What about burst traffic from campaigns?
Add one-off burst rows with start/end dates and expected peak multiplier. Remove after campaign ends so baseline forecast does not inherit temporary spikes permanently.
We buy credits, not per-token billing. Does this still apply?
Convert credits to equivalent token burn using vendor conversion tables. Forecast credits consumed per task the same way as dollar token cost.
Internal chatbots have uneven adoption. Tips?
Private chatbot pilots start with power users. Use cohort curves: week-one adopters vs late majority. Do not extrapolate week-one enthusiasm across the whole company.
Review this guide quarterly against your vendor admin console and finance exports. Interfaces change; caps move; new premium toggles appear inside familiar SKUs. A quarterly thirty-minute review keeps policy, forecast, and contract language aligned with what the product actually bills. Assign the review to a named role, not a mailing list.
When in doubt, measure for two weeks before committing annually or sunsetting a vendor. Short measurement windows beat long debates. Export logs, tag them, compute the metric or variance, then decide. Data ends internal stalemates that otherwise consume more payroll than the AI line item under discussion.
The Bottom Line
A solid forecast ai api spend model links users, tasks, tokens, seasonality, and price scenarios in one workbook finance trusts. Update monthly, stress-test price changes, and alert on variance before invoices close the quarter.