What is Short Interest Tracker?
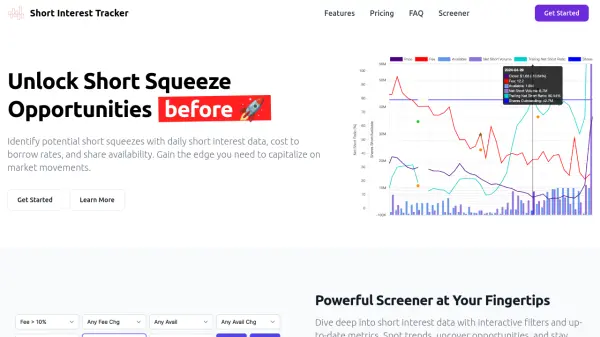
Short Interest Tracker is an AI-powered financial analytics platform designed to help traders identify potential short squeeze opportunities by providing comprehensive data on short interest ratios, cost to borrow rates, and share availability. The platform processes thousands of data points daily from reliable sources including FINRA, exchange-reported short interest, and brokerage data feeds to deliver up-to-date insights.
The tool features an advanced screener with interactive filters, historical data visualization, and backtesting capabilities that enable users to spot trends, detect sudden rate spikes or availability drops, and analyze market patterns. With coverage of over 10,000 stocks across equities and ETFs, Short Interest Tracker helps traders make informed decisions by highlighting potential short squeeze candidates through analysis of volume trends and market dynamics.
Features
- Advanced Screener: Interactive filters with up-to-date metrics for spotting trends and uncovering opportunities
- Historical Data Analysis: Comprehensive historical data for backtesting and pattern detection
- Real-time Updates: Data updated throughout the trading day with intra-day processing
- Multi-Source Data: Aggregated data from FINRA, exchange reports, brokerage feeds, and market makers
- Visualization Tools: Interactive charting capabilities for detailed analysis of short interest patterns
Use Cases
- Identifying potential short squeeze opportunities in the stock market
- Analyzing historical short interest trends for investment research
- Monitoring cost to borrow rates and share availability changes
- Backtesting trading strategies using comprehensive historical data
- Screening stocks based on short interest metrics and market dynamics
FAQs
-
What types of securities does Short Interest Tracker cover?
The platform covers equities, ETFs, and more across different markets, sectors, and industries, processing data for over 10,000 stocks. -
How does the platform identify potential short squeeze candidates?
It analyzes volume trends, market dynamics, short interest ratios, cost to borrow rates, and share availability data to highlight potential short squeeze opportunities. -
What time frames are available for historical data analysis?
Historical data is available for most major tickers going back several years, with different subscription tiers offering access to 1 week, 6 months, 1 year, or 2 years of historical data.