
ChartDB Uptime Monitor
Visualize your Database via One Single Query
Last 30 Days Performance
Average Uptime
0%
Based on 30-day monitoring period
Average Response Time
0ms
Mean response time across all checks
Daily Status Overview
Hover for detailsHistorical Performance
Jan-2026
100% uptime
Monthly Uptime
100%
Monthly Response Time
207ms
Daily Status Breakdown
Dec-2025
99.86% uptime
Monthly Uptime
99.86%
Monthly Response Time
215ms
Daily Status Breakdown
Nov-2025
100% uptime
Monthly Uptime
100%
Monthly Response Time
215ms
Daily Status Breakdown
Oct-2025
99.87% uptime
Monthly Uptime
99.87%
Monthly Response Time
222ms
Daily Status Breakdown
Sep-2025
100% uptime
Monthly Uptime
100%
Monthly Response Time
233ms
Daily Status Breakdown
Aug-2025
100% uptime
Monthly Uptime
100%
Monthly Response Time
201ms
Daily Status Breakdown
Jul-2025
99.72% uptime
Monthly Uptime
99.72%
Monthly Response Time
194ms
Daily Status Breakdown
Related Uptime Monitors
Explore uptime status for similar tools that also have monitoring enabled.
-
 Pending
Datanamic DeZign for Databases
Understand Your Database
Visual data modeling and database design tool supporting multiple platforms including Snowflake, Oracle, MS SQL, PostgreSQL, MySQL, and BigQuery.
Monitoring starting soon View Status -
 Operational
DatabaseSample
Open Source Database Designs for Collaborative Development
A comprehensive database design platform offering sample schemas, sandbox environment, and tools for creating, testing, and exporting database structures.
Last checked: 2 months ago View Status -
 Operational
chat2db-ai.com
Effortlessly manage multiple databases with AI for deep data insights and complex analysis.
Chat2DB is an AI-powered, open-source database management tool that simplifies SQL generation via natural language, supports diverse databases, and offers advanced data analysis capabilities.
Last checked: 2 months ago View Status -
 Operational
Chat2DB
AI SQL Generator for Easy Database Management
Chat2DB is a cross-platform AI database client that generates optimized SQL queries and provides actionable insights. It supports various databases, ensuring data privacy and efficient collaboration.
Last checked: 2 months ago View Status -
 Issues
ChatDBA
Never Worry about Database
ChatDBA is an AI-powered tool designed to simplify database operations through intelligent fault diagnosis, SQL generation, and performance optimization, leveraging an expert-backed knowledge base.
Last checked: 2 months ago View Status -
 Operational
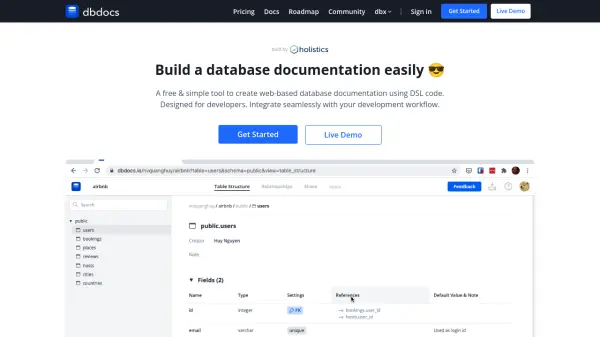
dbdocs
Web-Based Database Documentation As Code
dbdocs enables developers and data teams to efficiently create, manage, and share cloud-based database documentation using DBML code, streamlining collaboration and integration within DevOps workflows.
Last checked: 2 months ago View Status