
Zabbix Uptime Monitor
The universal, open-source observability solution for IT & OT
Last 30 Days Performance
Average Uptime
0%
Based on 30-day monitoring period
Average Response Time
0ms
Mean response time across all checks
Daily Status Overview
Hover for detailsRelated Uptime Monitors
Explore uptime status for similar tools that also have monitoring enabled.
-
 Operational
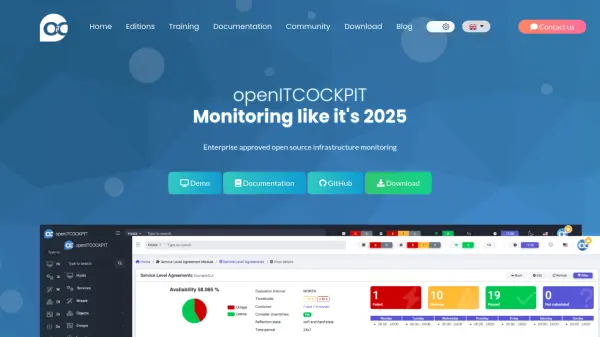
openITCOCKPIT
Enterprise-Grade Open Source Infrastructure Monitoring
openITCOCKPIT offers a robust, enterprise-approved open source platform for monitoring servers, devices, applications, containers, and cloud environments with seamless integrations and customizable dashboards.
Last checked: 2 months ago View Status -
 Operational
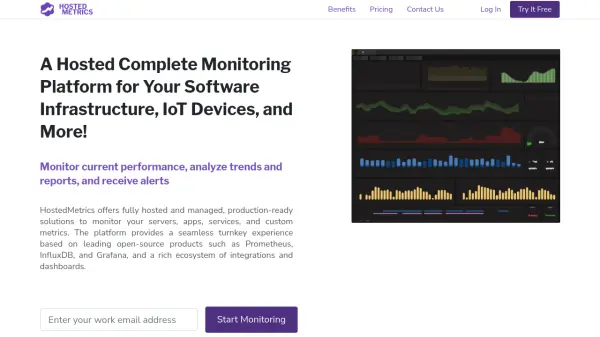
HostedMetrics
Hassle-Free, Fully Hosted Monitoring for Servers, Apps, and IoT
HostedMetrics delivers a fully managed platform for monitoring the performance and health of your software infrastructure, applications, and IoT devices, leveraging leading open-source technologies like Prometheus, InfluxDB, and Grafana.
Last checked: 2 months ago View Status -
 Operational
Icinga
Open-source infrastructure monitoring you own
Icinga is an open-source infrastructure monitoring platform that provides comprehensive visibility across hybrid IT environments, from on-premises systems to cloud and containerized deployments.
Last checked: 2 months ago View Status -
 Operational
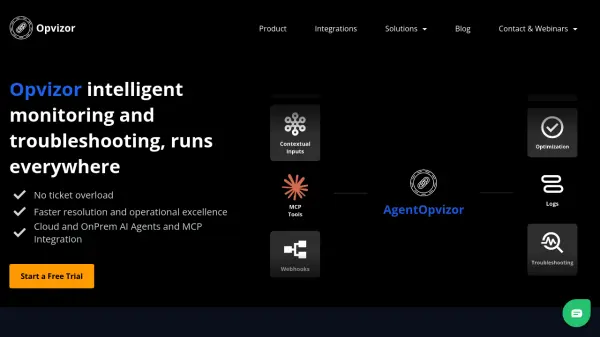
Opvizor
Intelligent monitoring and troubleshooting for virtualization and cloud environments
Opvizor is an AI-powered monitoring and troubleshooting platform that provides real-time insights, anomaly detection, and resource optimization for VMware, cloud, and container infrastructures.
Last checked: 2 months ago View Status -
 Operational
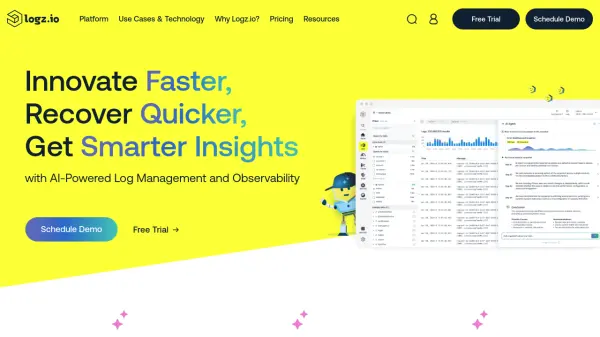
Logz.io
AI-Powered Observability and Log Management Platform
Logz.io is an AI-powered observability platform offering advanced log management, metrics, and distributed tracing to accelerate root cause analysis and system monitoring for modern IT environments.
Last checked: 2 months ago View Status -
 Operational
OpsDash
All-in-one solution for server monitoring, database monitoring, service monitoring and app metric monitoring
OpsDash is an all-in-one monitoring solution that provides fast setup and easy-to-use dashboards for server, database, service, and application metric monitoring with rule-based alerting and notifications.
Last checked: 2 months ago View Status