Supadash Uptime Monitor
Get a dashboard to visualize your data in seconds
Last 30 Days Performance
Average Uptime
99.44%
Based on 30-day monitoring period
Average Response Time
177.23ms
Mean response time across all checks
Daily Status Overview
Hover for detailsHistorical Performance
Dec-2025
99.83% uptime
Monthly Uptime
99.83%
Monthly Response Time
124ms
Daily Status Breakdown
Nov-2025
98.19% uptime
Monthly Uptime
98.19%
Monthly Response Time
123ms
Daily Status Breakdown
Oct-2025
99.73% uptime
Monthly Uptime
99.73%
Monthly Response Time
125ms
Daily Status Breakdown
Sep-2025
100% uptime
Monthly Uptime
100%
Monthly Response Time
129ms
Daily Status Breakdown
Aug-2025
100% uptime
Monthly Uptime
100%
Monthly Response Time
128ms
Daily Status Breakdown
Jul-2025
99.87% uptime
Monthly Uptime
99.87%
Monthly Response Time
120ms
Daily Status Breakdown
Jun-2025
99.92% uptime
Monthly Uptime
99.92%
Monthly Response Time
143ms
Daily Status Breakdown
May-2025
100% uptime
Monthly Uptime
100%
Monthly Response Time
132ms
Daily Status Breakdown
Apr-2025
99.26% uptime
Monthly Uptime
99.26%
Monthly Response Time
172ms
Daily Status Breakdown
Related Uptime Monitors
Explore uptime status for similar tools that also have monitoring enabled.
-
 Operational
Basedash
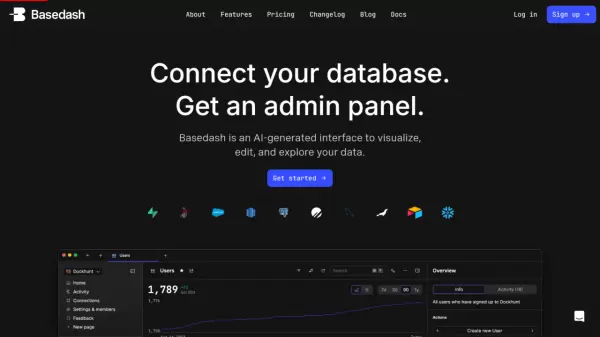
Connect your database. Get an admin panel.
Basedash is an AI-generated interface that transforms databases into collaborative workspaces for visualizing, editing, and exploring data without coding.
Last checked: 1 hour ago View Status -
 Issues
AI Dashboard Design
Design your Dashboard with AI
AI Dashboard Design uses artificial intelligence to help users create visually stunning and informative dashboards quickly with a drag-and-drop builder and AI-generated charts.
Last checked: 1 hour ago View Status -
 Operational
Dashbase
Quickly Create Analytics Dashboards from Any SQL Database with the Help of AI - No Code Required
Dashbase is an AI-powered analytics platform that enables users to create KPI dashboards from SQL databases using natural language queries and automated visualization tools.
Last checked: 1 hour ago View Status -
 Issues
Insiderviz
AI-powered data visualization platform
Insiderviz is an AI tool for creating interactive data visualizations and insights from complex datasets.
Last checked: 1 hour ago View Status -
 Operational
Chartbrew
Actionable insights for your team and clients
Chartbrew is an AI-powered data visualization and reporting platform that helps teams create interactive dashboards and reports from multiple data sources to track KPIs and improve decision-making.
Last checked: 1 hour ago View Status -
 Operational
Instadeq
No-code Data Analysis & Interactive Visualizations
Instadeq is a no-code platform enabling users to transform various data sources like spreadsheets and APIs into interactive, always up-to-date dashboards.
Last checked: 1 hour ago View Status