 ReddRadar

Respona Uptime Monitor
Drive more organic traffic to your website
Last 30 Days Performance
Average Uptime
0%
Based on 30-day monitoring period
Average Response Time
0ms
Mean response time across all checks
Daily Status Overview
Hover for detailsHistorical Performance
Jan-2026
100% uptime
Monthly Uptime
100%
Monthly Response Time
98ms
Daily Status Breakdown
Dec-2025
100% uptime
Monthly Uptime
100%
Monthly Response Time
143ms
Daily Status Breakdown
Nov-2025
99.86% uptime
Monthly Uptime
99.86%
Monthly Response Time
97ms
Daily Status Breakdown
Oct-2025
100% uptime
Monthly Uptime
100%
Monthly Response Time
105ms
Daily Status Breakdown
Sep-2025
99.85% uptime
Monthly Uptime
99.85%
Monthly Response Time
109ms
Daily Status Breakdown
Aug-2025
99.87% uptime
Monthly Uptime
99.87%
Monthly Response Time
136ms
Daily Status Breakdown
Jul-2025
99.85% uptime
Monthly Uptime
99.85%
Monthly Response Time
107ms
Daily Status Breakdown
Jun-2025
100% uptime
Monthly Uptime
100%
Monthly Response Time
138ms
Daily Status Breakdown
Related Uptime Monitors
Explore uptime status for similar tools that also have monitoring enabled.
-
 Operational
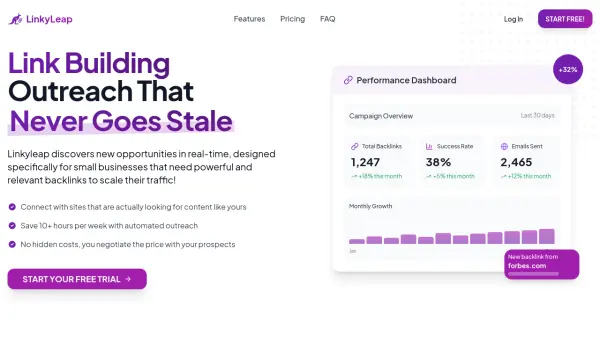
LinkyLeap
AI-Powered Link Building Outreach for Small Businesses
LinkyLeap uses AI agents to discover real-time link building opportunities and automate personalized outreach for small businesses seeking effective backlinks.
Last checked: 1 month ago View Status -
 Operational
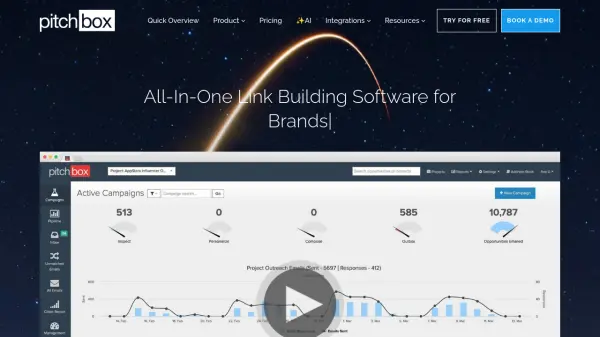
Pitchbox
All-In-One Link Building Software for Agencies, Publishers, and Brands
Pitchbox is an AI-powered link building and outreach platform that helps businesses find bloggers, publishers, and influencers to promote content and build quality backlinks.
Last checked: 1 month ago View Status -
 Issues
Postaga
Send Cold Email Easier Than Ever Before
Postaga is an AI-powered all-in-one outreach platform that helps businesses create personalized email campaigns, find relevant contacts, and manage outreach efforts efficiently.
Last checked: 1 month ago View Status -
 Issues
Coldmailbot
Automate Your Cold Emails: Our Bot Handles the Email Writing!
Coldmailbot is an AI-powered email automation tool that researches contacts, crafts personalized cold emails, and manages automated sending to boost engagement and save time.
Last checked: 1 month ago View Status -
 Operational
Outreachly
AI-Powered Sales Outreach Platform for Multi-Channel Lead Generation
Outreachly is an AI-powered sales outreach platform designed to scale multi-channel lead generation through automated LinkedIn and email campaigns, data enrichment, and CRM integration.
Last checked: 1 month ago View Status -
 Operational
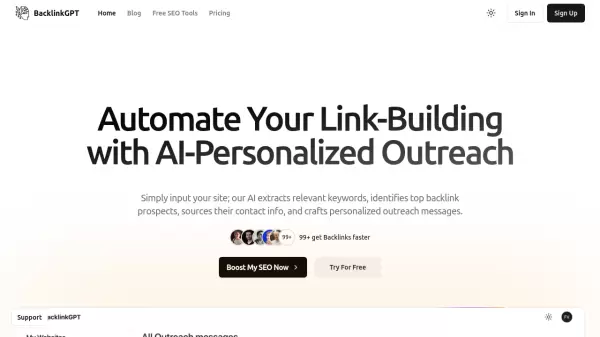
BacklinkGPT
Automate Your Link-Building with AI-Personalized Outreach
BacklinkGPT is an AI-powered link-building platform that automates backlink prospecting, contact discovery, and personalized outreach messaging to streamline the SEO process.
Last checked: 1 month ago View Status