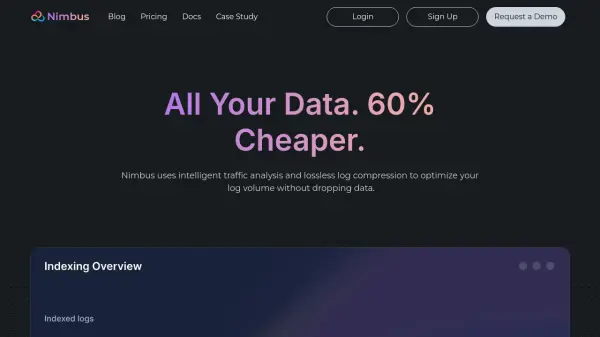
What is Nimbus?
Nimbus uses intelligent traffic analysis and lossless log compression to optimize your log volume without dropping data. It analyzes all incoming logs to identify common patterns and provides recommendations to reduce event volume significantly.
Nimbus ensures compatibility with existing monitors and dashboards. It also offers features like smart bypass for critical events and intelligent attribute mapping, allowing for detailed customization and efficient log management.
Features
- Powerful Recommendations: Optimizations based on distinct traffic patterns, reducing event volume significantly.
- Intelligent Traffic Analysis: Automatic identification of similar log groups for insights and optimization.
- Monitor and Dashboard Aware: Ensures optimizations are compatible with existing monitors and dashboards.
- Smart Bypass for Critical Events: Default non-aggregation of error logs and customizable bypass patterns.
- Intelligent Attribute Mapping (preview): Helps create and maintain standard attributes, identifying and mapping similar attributes.
- Useful Charts and Reports (preview): Provides understandable reports on usage and cost trends.
Use Cases
- Reducing log management costs.
- Optimizing log volume without data loss.
- Identifying and mapping log attributes.
- Maintaining compatibility with existing monitoring tools.
- Analyzing log traffic patterns.
FAQs
-
Does Nimbus add extra latency to my logs?
Nimbus processes logs in near real time - the average message is proxied in under 100ms. This means that real time use cases like live tail are typically unaffected when using Nimbus. There is a processing delay for aggregated logs - these are held until specific criteria are met (eg. max events, max timeout, stop condition, etc). How long aggregated logs are delayed depends on the aggregation criteria and is completely customizable by the user. It can also be paused or turned off at any time.Nimbus also allows you to create bypass rules that ensure high priority logs are never aggregated. Error logs are bypassed by default. -
What is Nimbus's availability?
Nimbus is highly available and has a guaranteed public SLA of 99.999%. It is staffed and operated by a ex-AWS engineers that have built some of the most widely available systems in the world. You can get real time visibility of Nimbus status via our status page. -
How much does Nimbus cost?
Nimbus charges $0.10 per GiB processed and 30% of savings. For logs, this means we charge 30% of your log indexing price of the log events that Nimbus is reducing. Generally, customers end up saving 60% off their bill AFTER paying for Nimbus. -
Do you offer a trial?
Yes. All customers get a risk free 2 week trial. It generally takes less than 30 minutes to setup the initial integration and a few days to see drastic volume reduction. -
Do you support other vendors besides Datadog?
Yes. Please contact us at sales@nimbus.dev for details on other vendor integrations.