What is DebugBear?
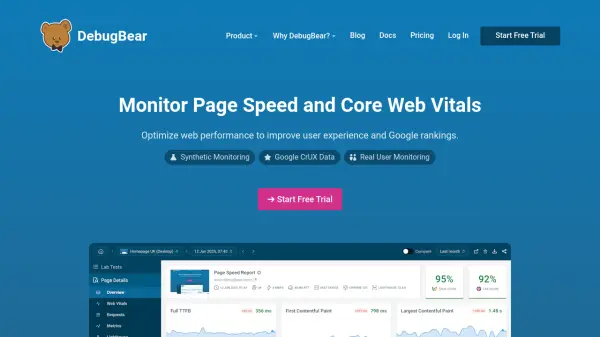
DebugBear is a powerful website performance monitoring platform designed to help teams optimize page speed and Core Web Vitals. It combines synthetic monitoring, real user monitoring (RUM), and Google CrUX data to provide a complete view of website performance. The tool identifies slow pages, diagnoses performance bottlenecks, and offers detailed technical reporting including network request waterfalls, CPU task correlation, and AI agent prompts for actionable fixes. DebugBear also features automated change notifications, video exports, chart annotations, and API integration to streamline performance workflows and facilitate team collaboration.
Features
- Synthetic Monitoring: Run scheduled lab tests and track Google Lighthouse scores continuously.
- Real User Monitoring (RUM): Track actual visitor experience across your website in real time.
- Google CrUX Data: Monitor visitor data from Google's Chrome User Experience Report.
- Detailed Performance Recommendations: Automatically identify problems and highlight data needed to fix them.
- Network Request Waterfall: Get detailed reports correlating network activity with CPU tasks and rendering.
- AI Agent Prompts: Generate ready-to-use prompts for AI coding agents like Claude Code or Cursor.
- Automated Change Notifications: Zero-config alerts for regressions like render-blocking scripts or large images.
- Video Export: Demonstrate visitor experience with side-by-side or before/after videos.
- Chart Annotations: Mark deployments or third-party changes to see performance impact.
- API Integration: Trigger synthetic tests, access RUM data, or receive webhook alerts.
Use Cases
- Improve Google rankings by optimizing Core Web Vitals.
- Monitor and debug page speed issues for ecommerce stores to increase conversion rates.
- Track real user experience across large enterprise websites.
- Automate performance testing and alerting in CI/CD pipelines.
- Benchmark website performance against competitors using real visitor data.
FAQs
-
What is the difference between synthetic monitoring and real user monitoring?
Synthetic monitoring runs scheduled lab tests in a controlled environment to track Lighthouse scores and detect regressions. Real user monitoring (RUM) collects data from actual visitors, providing insights into real-world performance and user experience. -
How does DebugBear help with Core Web Vitals optimization?
DebugBear identifies slow interactions, diagnoses bottlenecks with network waterfalls, provides AI-generated fix prompts, and offers before/after comparisons to track optimization impact. -
Can I try DebugBear without a credit card?
Yes, DebugBear offers a free trial with no credit card required. -
Does DebugBear support API integration?
Yes, DebugBear provides an API to trigger synthetic tests, access RUM data, and receive webhook alerts when tests finish.