What is Citadel5?
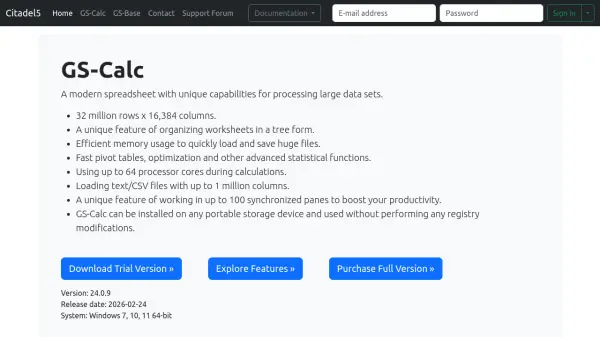
Citadel5 provides two powerful software tools: GS-Calc and GS-Base. GS-Calc is a modern spreadsheet application designed to handle extremely large data sets, supporting up to 32 million rows and 16,384 columns. It features unique capabilities such as organizing worksheets in a tree structure, efficient memory usage for quick file operations, and leveraging up to 64 processor cores for calculations. The tool also includes fast pivot tables, optimization functions, and advanced statistical features, making it suitable for complex data analysis tasks.
GS-Base is a flexible database that accommodates various data types, including text, numeric fields, dates, files, images, and code snippets with syntax highlighting for 16 programming languages. It supports up to 256 million rows and 16K columns, enabling both simple and complex data operations like filtering, searching, and pivot table analysis. Both tools are designed for Windows systems and offer trial versions for evaluation, with options to purchase full versions for extended functionality.
Features
- GS-Calc Spreadsheet: Supports up to 32 million rows and 16,384 columns with tree-structured worksheets
- GS-Calc Performance: Uses up to 64 processor cores for calculations and efficient memory usage
- GS-Calc File Handling: Loads text/CSV files with up to 1 million columns and works in synchronized panes
- GS-Base Database: Stores text, numeric fields, dates, files, images, and code snippets with syntax highlighting
- GS-Base Scalability: Handles up to 256 million rows and 16K columns, adaptable from small to large databases
- GS-Base Analysis: Supports filtering, searching, pivot tables, and integration with Python libraries
Use Cases
- Processing and analyzing large datasets in spreadsheets
- Managing inventory or personnel records in a database
- Performing statistical analysis and optimization calculations
- Storing and querying diverse data types like files and images
- Conducting full-text searches and duplicate detection in databases
- Creating pivot tables for data summarization and trend analysis