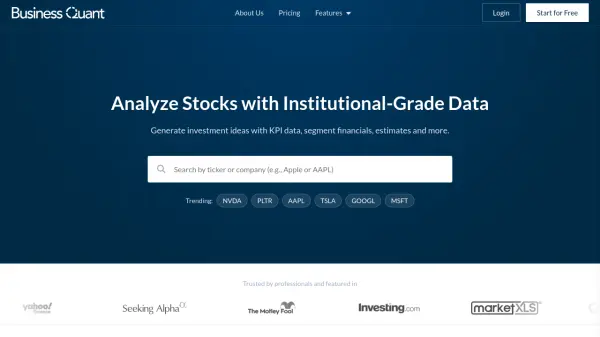
What is Business Quant?
Business Quant is a modern platform designed for fundamental stock research, offering institutional-grade data and powerful analytical tools. It provides access to 15+ years of financial statements, KPI and operating metrics, stock screening capabilities, advanced charting, industry financials, and timeseries tables. The platform covers over 20,000 key performance indicators across 2,000+ US stocks, with data updated daily to ensure freshness ahead of official SEC filings.
The platform features a clean, intuitive interface that balances power with simplicity, making professional-grade data accessible without overwhelming users. It includes tools for segment financial analysis, analyst estimates, data export functionality, and industry benchmarking. Business Quant is trusted by thousands of investors and financial professionals for its comprehensive data coverage, fast performance, and reliable data quality.
Features
- KPI & Operating Metrics: Access to 20,000+ key performance indicators across 2,000+ US stocks, including segment financials and operating data
- Stock Screener: Filter thousands of US stocks using 1,200+ financial metrics to identify investment opportunities
- Financial Statements: Analyze 15+ years of financial data with daily updates ahead of official SEC filings
- Advanced Charting: Visualize financial metrics with powerful charting tools to identify trends and compare companies
- Industry Financials: Benchmark companies against industry peers using latest financial data and performance ratios
- Timeseries Tables: Compare fundamental data across stocks, industries, or sectors in time-series format
- Data Export: Download clean, standardized data in CSV and XLSX formats for external analysis
- Analyst Estimates: Access up to 3 years and 12 quarters of analyst estimates for comprehensive research
Use Cases
- Generating investment ideas using KPI data and segment financials
- Screening thousands of stocks to identify market opportunities
- Analyzing company financials and performance trends over time
- Benchmarking companies against industry peers for competitive analysis
- Visualizing financial metrics through advanced charting tools
- Exporting clean financial data for external modeling and analysis
- Researching analyst estimates and institutional ownership data
- Monitoring key performance indicators for specific companies or sectors