Last9 MCP Server
Enables AI agents to access real-time production observability data for automated code fixes.
Key Features
Use Cases
README
Last9 MCP Server
A Model Context Protocol server implementation for Last9 that enables AI agents to seamlessly bring real-time production context — logs, metrics, and traces — into your local environment to auto-fix code faster.
- View demo
- Read our announcement blog post
Status
Works with Claude desktop app, or Cursor, Windsurf, and VSCode (Github Copilot) IDEs. Implements the following MCP tools:
Observability & APM Tools:
get_exceptions: Get the list of exceptions.get_service_summary: Get service summary with throughput, error rate, and response time.get_service_environments: Get available environments for services.get_service_performance_details: Get detailed performance metrics for a service.get_service_operations_summary: Get operations summary for a service.get_service_dependency_graph: Get service dependency graph showing incoming/outgoing dependencies.
Prometheus/PromQL Tools:
prometheus_range_query: Execute PromQL range queries for metrics data.prometheus_instant_query: Execute PromQL instant queries for metrics data.prometheus_label_values: Get label values for PromQL queries.prometheus_labels: Get available labels for PromQL queries.
Logs Management:
get_logs: Get logs filtered by service name and/or severity level.get_drop_rules: Get drop rules for logs that determine what logs get filtered out at Last9 Control Planeadd_drop_rule: Create a drop rule for logs at Last9 Control Planeget_service_logs: Get raw log entries for a specific service over a time range. Can apply filters on severity and body.get_log_attributes: Get available log attributes (labels) for a specified time window.
Traces Management:
get_traces: Retrieve traces using JSON pipeline queries for advanced filtering.get_service_traces: Retrieve traces by trace ID or service name with time range filtering.get_trace_attributes: Get available trace attributes (series) for a specified time window.
Change Events:
get_change_events: Get change events from the last9_change_events prometheus metric over a given time range.
Alert Management:
get_alert_config: Get alert configurations (alert rules) from Last9.get_alerts: Get currently active alerts from Last9 monitoring system.
Tools Documentation
get_exceptions
Retrieves server-side exceptions over a specified time range.
Parameters:
limit(integer, optional): Maximum number of exceptions to return. Default: 20.lookback_minutes(integer, recommended): Number of minutes to look back from now. Default: 60. Examples: 60, 30, 15.start_time_iso(string, optional): Start time in ISO format (YYYY-MM-DD HH:MM:SS). Leave empty to use lookback_minutes.end_time_iso(string, optional): End time in ISO format (YYYY-MM-DD HH:MM:SS). Leave empty to default to current time.service_name(string, optional): Filter exceptions by service name (e.g., api-service).span_name(string, optional): Name of the span to filter by.deployment_environment(string, optional): Filter exceptions by deployment environment from resource attributes (e.g., production, staging).
get_service_summary
Get service summary over a given time range. Includes service name, environment, throughput, error rate, and response time. All values are p95 quantiles over the time range.
Parameters:
start_time_iso(string, optional): Start time in ISO format (YYYY-MM-DD HH:MM:SS). Leave empty to default to end_time_iso - 1 hour.end_time_iso(string, optional): End time in ISO format (YYYY-MM-DD HH:MM:SS). Leave empty to default to current time.env(string, optional): Environment to filter by. Defaults to 'prod'.
get_service_environments
Get available environments for services. Returns an array of environments that can be used with other APM tools.
Parameters:
start_time_iso(string, optional): Start time in ISO format (YYYY-MM-DD HH:MM:SS). Leave empty to default to end_time_iso - 1 hour.end_time_iso(string, optional): End time in ISO format (YYYY-MM-DD HH:MM:SS). Leave empty to default to current time.
Note: All other APM tools that retrieve service information (like get_service_performance_details, get_service_dependency_graph, get_service_operations_summary, get_service_summary) require an env parameter. This parameter must be one of the environments returned by this tool. If this tool returns an empty array, use an empty string "" for the env parameter.
get_service_performance_details
Get detailed performance metrics for a specific service over a given time range.
Parameters:
service_name(string, required): Name of the service to get performance details for.start_time_iso(string, optional): Start time in ISO format (YYYY-MM-DD HH:MM:SS). Leave empty to default to now - 60 minutes.end_time_iso(string, optional): End time in ISO format (YYYY-MM-DD HH:MM:SS). Leave empty to default to current time.env(string, optional): Environment to filter by. Defaults to 'prod'.
get_service_operations_summary
Get a summary of operations inside a service over a given time range. Returns operations like HTTP endpoints, database queries, messaging producer and HTTP client calls.
Parameters:
service_name(string, required): Name of the service to get operations summary for.start_time_iso(string, optional): Start time in ISO format (YYYY-MM-DD HH:MM:SS). Leave empty to default to now - 60 minutes.end_time_iso(string, optional): End time in ISO format (YYYY-MM-DD HH:MM:SS). Leave empty to default to current time.env(string, optional): Environment to filter by. Defaults to 'prod'.
get_service_dependency_graph
Get details of the throughput, response times and error rates of incoming, outgoing and infrastructure components of a service. Useful for analyzing cascading effects of errors and performance issues.
Parameters:
service_name(string, optional): Name of the service to get the dependency graph for.start_time_iso(string, optional): Start time in ISO format (YYYY-MM-DD HH:MM:SS). Leave empty to default to now - 60 minutes.end_time_iso(string, optional): End time in ISO format (YYYY-MM-DD HH:MM:SS). Leave empty to default to current time.env(string, optional): Environment to filter by. Defaults to 'prod'.
prometheus_range_query
Perform a Prometheus range query to get metrics data over a specified time range. Recommended to check available labels first using prometheus_labels tool.
Parameters:
query(string, required): The range query to execute.start_time_iso(string, optional): Start time in ISO format (YYYY-MM-DD HH:MM:SS). Leave empty to default to now - 60 minutes.end_time_iso(string, optional): End time in ISO format (YYYY-MM-DD HH:MM:SS). Leave empty to default to current time.
prometheus_instant_query
Perform a Prometheus instant query to get metrics data at a specific point in time. Typically should use rollup functions like sum_over_time, avg_over_time, quantile_over_time over a time window.
Parameters:
query(string, required): The instant query to execute.time_iso(string, optional): Time in ISO format (YYYY-MM-DD HH:MM:SS). Leave empty to default to current time.
prometheus_label_values
Return the label values for a particular label and PromQL filter query. Similar to Prometheus /label_values call.
Parameters:
match_query(string, required): A valid PromQL filter query.label(string, required): The label to get values for.start_time_iso(string, optional): Start time in ISO format (YYYY-MM-DD HH:MM:SS). Leave empty to default to now - 60 minutes.end_time_iso(string, optional): End time in ISO format (YYYY-MM-DD HH:MM:SS). Leave empty to default to current time.
prometheus_labels
Return the labels for a given PromQL match query. Similar to Prometheus /labels call.
Parameters:
match_query(string, required): A valid PromQL filter query.start_time_iso(string, optional): Start time in ISO format (YYYY-MM-DD HH:MM:SS). Leave empty to default to now - 60 minutes.end_time_iso(string, optional): End time in ISO format (YYYY-MM-DD HH:MM:SS). Leave empty to default to current time.
get_logs
Gets logs filtered by service name and/or severity level within a specified time range. This tool now uses the advanced v2 logs API with physical index optimization for better performance.
Note: This tool now requires a service_name parameter and internally uses the same advanced infrastructure as get_service_logs.
Parameters:
service_name(string, required): Name of the service to get logs for.severity(string, optional): Severity of the logs to get (automatically converted to severity_filters format).lookback_minutes(integer, recommended): Number of minutes to look back from now. Default: 60. Examples: 60, 30, 15.start_time_iso(string, optional): Start time in ISO format (YYYY-MM-DD HH:MM:SS). Leave empty to use lookback_minutes.end_time_iso(string, optional): End time in ISO format (YYYY-MM-DD HH:MM:SS). Leave empty to default to current time.limit(integer, optional): Maximum number of logs to return. Default: 20.env(string, optional): Environment to filter by. Use "get_service_environments" tool to get available environments.
get_drop_rules
Gets drop rules for logs, which determine what logs get filtered out from reaching Last9.
add_drop_rule
Adds a new drop rule to filter out specific logs at Last9 Control Plane
Parameters:
name(string, required): Name of the drop rule.filters(array, required): List of filter conditions to apply. Each filter has:key(string, required): The key to filter on. Only attributes and resource.attributes keys are supported. For resource attributes, use format: resource.attributes[key_name] and for log attributes, use format: attributes[key_name] Double quotes in key names must be escaped.value(string, required): The value to filter against.operator(string, required): The operator used for filtering. Valid values:- "equals"
- "not_equals"
conjunction(string, required): The logical conjunction between filters. Valid values:- "and"
get_alert_config
Get alert configurations (alert rules) from Last9. Returns all configured alert rules including their conditions, labels, and annotations.
Parameters:
None - This tool retrieves all available alert configurations.
Returns information about:
- Alert rule ID and name
- Primary indicator being monitored
- Current state and severity
- Algorithm used for alerting
- Entity ID and organization details
- Properties and configuration
- Creation and update timestamps
- Group timeseries notification settings
get_alerts
Get currently active alerts from Last9 monitoring system. Returns all alerts that are currently firing or have fired recently within the specified time window.
Parameters:
timestamp(integer, optional): Unix timestamp for the query time. Leave empty to default to current time.window(integer, optional): Time window in seconds to look back for alerts. Defaults to 900 seconds (15 minutes). Range: 60-86400 seconds.
Returns information about:
- Alert rule details (ID, name, group, type)
- Current state and severity
- Last fired timestamp and duration
- Rule properties and configuration
- Alert instances with current values
- Metric degradation information
- Group labels and annotations for each instance
get_service_logs
Get raw log entries for a specific service over a time range. This tool retrieves actual log entries including log messages, timestamps, severity levels, and other metadata. Useful for debugging issues, monitoring service behavior, and analyzing specific log patterns.
Parameters:
service_name(string, required): Name of the service to get logs for.lookback_minutes(integer, optional): Number of minutes to look back from now. Default: 60 minutes. Examples: 60, 30, 15.limit(integer, optional): Maximum number of log entries to return. Default: 20.env(string, optional): Environment to filter by. Use "get_service_environments" tool to get available environments.severity_filters(array, optional): Array of severity patterns to filter logs (e.g., ["error", "warn"]). Uses OR logic.body_filters(array, optional): Array of message content patterns to filter logs (e.g., ["timeout", "failed"]). Uses OR logic.start_time_iso(string, optional): Start time in ISO format (YYYY-MM-DD HH:MM:SS). Leave empty to default to now - lookback_minutes.end_time_iso(string, optional): End time in ISO format (YYYY-MM-DD HH:MM:SS). Leave empty to default to current time.
Filtering behavior:
- Multiple filter types are combined with AND logic (service AND severity AND body)
- Each filter array uses OR logic (matches any pattern in the array)
Examples:
- service_name="api" + severity_filters=["error"] + body_filters=["timeout"] → finds error logs containing "timeout"
- service_name="web" + body_filters=["timeout", "failed", "error 500"] → finds logs containing any of these patterns
get_log_attributes
Get available log attributes (labels) for a specified time window. This tool retrieves all attribute names that exist in logs during the specified time range, which can be used for filtering and querying logs.
Parameters:
lookback_minutes(integer, optional): Number of minutes to look back from now for the time window. Default: 15. Examples: 15, 30, 60.start_time_iso(string, optional): Start time in ISO format (YYYY-MM-DD HH:MM:SS). Leave empty to use lookback_minutes.end_time_iso(string, optional): End time in ISO format (YYYY-MM-DD HH:MM:SS). Leave empty to default to current time.region(string, optional): AWS region to query. Leave empty to use default from configuration. Examples: ap-south-1, us-east-1, eu-west-1.
Returns:
- List of log attributes grouped into two categories:
- Log Attributes: Standard log fields like service, severity, body, level, etc.
- Resource Attributes: Resource-related fields prefixed with "resource_" like resource_k8s.pod.name, resource_service.name, etc.
get_traces
Execute advanced trace queries using JSON pipeline syntax for complex filtering and aggregation. This tool provides powerful querying capabilities for traces using a pipeline-based approach with filters, aggregations, and transformations.
Parameters:
tracejson_query(array, required): JSON pipeline query for traces. Use the tracejson_query_builder prompt to generate JSON pipeline queries from natural language.start_time_iso(string, optional): Start time in ISO format (YYYY-MM-DD HH:MM:SS).end_time_iso(string, optional): End time in ISO format (YYYY-MM-DD HH:MM:SS).lookback_minutes(integer, optional): Number of minutes to look back from now. Default: 60 minutes.limit(integer, optional): Maximum number of traces to return. Default: 20. Range: 1-100.
This tool supports complex queries with multiple filter conditions, aggregations, and custom processing pipelines for advanced trace analysis.
get_service_traces
Retrieve traces from Last9 by trace ID or service name. This tool allows you to get specific traces either by providing a trace ID for a single trace, or by providing a service name to get all traces for that service within a time range.
Parameters:
trace_id(string, optional): Specific trace ID to retrieve. Cannot be used with service_name.service_name(string, optional): Name of service to get traces for. Cannot be used with trace_id.lookback_minutes(integer, optional): Number of minutes to look back from now. Default: 60 minutes. Examples: 60, 30, 15.start_time_iso(string, optional): Start time in ISO format (YYYY-MM-DD HH:MM:SS). Leave empty to use lookback_minutes.end_time_iso(string, optional): End time in ISO format (YYYY-MM-DD HH:MM:SS). Leave empty to default to current time.limit(integer, optional): Maximum number of traces to return. Default: 10. Range: 1-100.env(string, optional): Environment to filter by. Use "get_service_environments" tool to get available environments.
Usage rules:
- Exactly one of
trace_idorservice_namemust be provided (not both, not neither) - Time range filtering only applies when using
service_name
Examples:
- trace_id="abc123def456" - retrieves the specific trace
- service_name="payment-service" + lookback_minutes=30 - gets all payment service traces from last 30 minutes
Returns trace data including trace IDs, spans, duration, timestamps, and status information.
get_trace_attributes
Get available trace attributes (series) for a specified time window. This tool retrieves all attribute names that exist in traces during the specified time range, which can be used for filtering and querying traces.
Parameters:
lookback_minutes(integer, optional): Number of minutes to look back from now for the time window. Default: 15. Examples: 15, 30, 60.start_time_iso(string, optional): Start time in ISO format (YYYY-MM-DD HH:MM:SS). Leave empty to use lookback_minutes.end_time_iso(string, optional): End time in ISO format (YYYY-MM-DD HH:MM:SS). Leave empty to default to current time.region(string, optional): AWS region to query. Leave empty to use default from configuration. Examples: ap-south-1, us-east-1, eu-west-1.
Returns:
- An alphabetically sorted list of all available trace attributes (e.g., http.method, http.status_code, db.name, resource_service.name, duration, etc.)
get_change_events
Get change events from the last9_change_events prometheus metric over a given time range. Returns change events that occurred in the specified time window, including deployments, configuration changes, and other system modifications.
Parameters:
start_time_iso(string, optional): Start time in ISO format (YYYY-MM-DD HH:MM:SS). Leave empty to default to now - lookback_minutes.end_time_iso(string, optional): End time in ISO format (YYYY-MM-DD HH:MM:SS). Leave empty to default to current time.lookback_minutes(integer, optional): Number of minutes to look back from now. Default: 60 minutes. Examples: 60, 30, 15.service(string, optional): Name of the service to filter change events for.environment(string, optional): Environment to filter by.event_name(string, optional): Name of the change event to filter by (use available_event_names to see valid values).
Returns:
available_event_names: List of all available event types that can be used for filteringchange_events: Array of timeseries data with metric labels and timestamp-value pairscount: Total number of change events returnedtime_range: Start and end time of the query window
Each change event includes:
metric: Map of metric labels (service_name, env, event_type, message, etc.)values: Array of timestamp-value pairs representing the timeseries data
Common event types include: deployment, config_change, rollback, scale_up/scale_down, restart, upgrade/downgrade, maintenance, backup/restore, health_check, certificate, database.
Best practices:
- First call without event_name to get available_event_names
- Use exact event name from available_event_names for the event_name parameter
- Combine with other filters (service, environment, time) for precise results
Installation
You can install and run the Last9 Observability MCP server in several ways:
Local Installation
For local development and traditional STDIO usage:
Homebrew
# Add the Last9 tap
brew tap last9/tap

# Install the Last9 MCP CLI
brew install last9-mcp
NPM
# Install globally
npm install -g @last9/mcp-server

# Or run directly with npx
npx @last9/mcp-server
Configuration
Environment Variables
The Last9 MCP server requires the following environment variables:
LAST9_BASE_URL: (required) Last9 API URL from OTel integrationLAST9_AUTH_TOKEN: (required) Authentication token for Last9 MCP server from OTel integrationLAST9_REFRESH_TOKEN: (required) Refresh Token with Write permissions, needed for accessing control plane APIs from API AccessOTEL_EXPORTER_OTLP_ENDPOINT: (required) OpenTelemetry collector endpoint URLOTEL_EXPORTER_OTLP_HEADERS: (required) Headers for OTLP exporter authentication
Usage
Usage with Claude Desktop
Configure the Claude app to use the MCP server:
- Open the Claude Desktop app, go to Settings, then Developer
- Click Edit Config
- Open the
claude_desktop_config.jsonfile - Copy and paste the server config to your existing file, then save
- Restart Claude
If installed via Homebrew:
{
  "mcpServers": {
    "last9": {
      "command": "/opt/homebrew/bin/last9-mcp",
      "env": {
        "LAST9_BASE_URL": "<last9_otlp_host>",
        "LAST9_AUTH_TOKEN": "<last9_otlp_auth_token>",
        "LAST9_REFRESH_TOKEN": "<last9_write_refresh_token>",
        "OTEL_EXPORTER_OTLP_ENDPOINT": "<otel_endpoint_url>",
        "OTEL_EXPORTER_OTLP_HEADERS": "<otel_headers>"
      }
    }
  }
}
If installed via NPM:
{
  "mcpServers": {
    "last9": {
      "command": "npx",
      "args": ["-y", "@last9/mcp-server"],
      "env": {
        "LAST9_BASE_URL": "<last9_otlp_host>",
        "LAST9_AUTH_TOKEN": "<last9_otlp_auth_token>",
        "LAST9_REFRESH_TOKEN": "<last9_write_refresh_token>",
        "OTEL_EXPORTER_OTLP_ENDPOINT": "<otel_endpoint_url>",
        "OTEL_EXPORTER_OTLP_HEADERS": "<otel_headers>"
      }
    }
  }
}
Usage with Cursor
Configure Cursor to use the MCP server:
- Open Cursor, go to Settings, then Cursor Settings
- Select MCP on the left
- Click Add "New Global MCP Server" at the top right
- Copy and paste the server config to your existing file, then save
- Restart Cursor
If installed via Homebrew:
{
  "mcpServers": {
    "last9": {
      "command": "/opt/homebrew/bin/last9-mcp",
      "env": {
        "LAST9_BASE_URL": "<last9_otlp_host>",
        "LAST9_AUTH_TOKEN": "<last9_otlp_auth_token>",
        "LAST9_REFRESH_TOKEN": "<last9_write_refresh_token>",
        "OTEL_EXPORTER_OTLP_ENDPOINT": "<otel_endpoint_url>",
        "OTEL_EXPORTER_OTLP_HEADERS": "<otel_headers>"
      }
    }
  }
}
If installed via NPM:
{
  "mcpServers": {
    "last9": {
      "command": "npx",
      "args": ["-y", "@last9/mcp-server"],
      "env": {
        "LAST9_BASE_URL": "<last9_otlp_host>",
        "LAST9_AUTH_TOKEN": "<last9_otlp_auth_token>",
        "LAST9_REFRESH_TOKEN": "<last9_write_refresh_token>",
        "OTEL_EXPORTER_OTLP_ENDPOINT": "<otel_endpoint_url>",
        "OTEL_EXPORTER_OTLP_HEADERS": "<otel_headers>"
      }
    }
  }
}
Usage with Windsurf
Configure Windsurf to use the MCP server:
- Open Windsurf, go to Settings, then Developer
- Click Edit Config
- Open the
windsurf_config.jsonfile - Copy and paste the server config to your existing file, then save
- Restart Windsurf
If installed via Homebrew:
{
  "mcpServers": {
    "last9": {
      "command": "/opt/homebrew/bin/last9-mcp",
      "env": {
        "LAST9_BASE_URL": "<last9_otlp_host>",
        "LAST9_AUTH_TOKEN": "<last9_otlp_auth_token>",
        "LAST9_REFRESH_TOKEN": "<last9_write_refresh_token>",
        "OTEL_EXPORTER_OTLP_ENDPOINT": "<otel_endpoint_url>",
        "OTEL_EXPORTER_OTLP_HEADERS": "<otel_headers>"
      }
    }
  }
}
If installed via NPM:
{
  "mcpServers": {
    "last9": {
      "command": "npx",
      "args": ["-y", "@last9/mcp-server"],
      "env": {
        "LAST9_BASE_URL": "<last9_otlp_host>",
        "LAST9_AUTH_TOKEN": "<last9_otlp_auth_token>",
        "LAST9_REFRESH_TOKEN": "<last9_write_refresh_token>",
        "OTEL_EXPORTER_OTLP_ENDPOINT": "<otel_endpoint_url>",
        "OTEL_EXPORTER_OTLP_HEADERS": "<otel_headers>"
      }
    }
  }
}
Usage with VS Code
Note: MCP support in VS Code is available starting v1.99 and is currently in preview. For advanced configuration options and alternative setup methods, view the VS Code MCP documentation.
- Open VS Code, go to Settings, select the User tab, then Features, then Chat
- Click "Edit settings.json"
- Copy and paste the server config to your existing file, then save
- Restart VS Code
If installed via Homebrew:
{
  "mcp": {
    "servers": {
      "last9": {
        "type": "stdio",
        "command": "/opt/homebrew/bin/last9-mcp",
        "env": {
          "LAST9_BASE_URL": "<last9_otlp_host>",
          "LAST9_AUTH_TOKEN": "<last9_otlp_auth_token>",
          "LAST9_REFRESH_TOKEN": "<last9_write_refresh_token>",
          "OTEL_EXPORTER_OTLP_ENDPOINT": "<otel_endpoint_url>",
          "OTEL_EXPORTER_OTLP_HEADERS": "<otel_headers>"
        }
      }
    }
  }
}
If installed via NPM:
{
  "mcp": {
    "servers": {
      "last9": {
        "type": "stdio",
        "command": "npx",
        "args": ["-y", "@last9/mcp-server"],
        "env": {
          "LAST9_BASE_URL": "<last9_otlp_host>",
          "LAST9_AUTH_TOKEN": "<last9_otlp_auth_token>",
          "LAST9_REFRESH_TOKEN": "<last9_write_refresh_token>",
          "OTEL_EXPORTER_OTLP_ENDPOINT": "<otel_endpoint_url>",
          "OTEL_EXPORTER_OTLP_HEADERS": "<otel_headers>"
        }
      }
    }
  }
}
Development
For local development and testing, you can run the MCP server in HTTP mode which makes it easier to debug requests and responses.
Running in HTTP Mode
Set the HTTP_MODE environment variable to enable HTTP server mode:
# Export required environment variables
export LAST9_API_TOKEN="your_api_token"
export LAST9_BASE_URL="https://your-last9-endpoint"  # Your Last9 endpoint
export OTEL_EXPORTER_OTLP_ENDPOINT="<otel_endpoint_url>"
export OTEL_EXPORTER_OTLP_HEADERS="<otel_headers>"
export HTTP_MODE=true
export HTTP_PORT=8080  # Optional, defaults to 8080

# Run the server
./last9-mcp-server
The server will start on http://localhost:8080/mcp and you can test it with curl:
Testing with curl
# Test get_service_logs
curl -X POST http://localhost:8080/mcp \
    -H "Content-Type: application/json" \
    -H "Mcp-Session-Id: session_$(date +%s)000000000" \
    -d '{
      "jsonrpc": "2.0",
      "id": 1,
      "method": "tools/call",
      "params": {
        "name": "get_service_logs",
        "arguments": {
          "service_name": "your-service-name",
          "lookback_minutes": 30,
          "limit": 10
        }
      }
    }'

# Test get_service_traces
curl -X POST http://localhost:8080/mcp \
    -H "Content-Type: application/json" \
    -H "Mcp-Session-Id: session_$(date +%s)000000000" \
    -d '{
      "jsonrpc": "2.0",
      "id": 2,
      "method": "tools/call",
      "params": {
        "name": "get_service_traces",
        "arguments": {
          "service_name": "your-service-name",
          "lookback_minutes": 60,
          "limit": 5
        }
      }
    }'

# List available tools
curl -X POST http://localhost:8080/mcp \
    -H "Content-Type: application/json" \
    -H "Mcp-Session-Id: session_$(date +%s)000000000" \
    -d '{
      "jsonrpc": "2.0",
      "id": 3,
      "method": "tools/list",
      "params": {}
    }'
Building from Source
# Clone the repository
git clone https://github.com/last9/last9-mcp-server.git
cd last9-mcp-server

# Build the binary
go build -o last9-mcp-server

# Run in development mode
HTTP_MODE=true ./last9-mcp-server
Note: HTTP mode is for development and testing only. When integrating with Claude Desktop or other MCP clients, use the default STDIO mode (without HTTP_MODE=true).
Badges
![]()
Star History
Repository Owner

Organization
Repository Details
Programming Languages
Tags
Topics
Join Our Newsletter
Stay updated with the latest AI tools, news, and offers by subscribing to our weekly newsletter.
Related MCPs
Discover similar Model Context Protocol servers
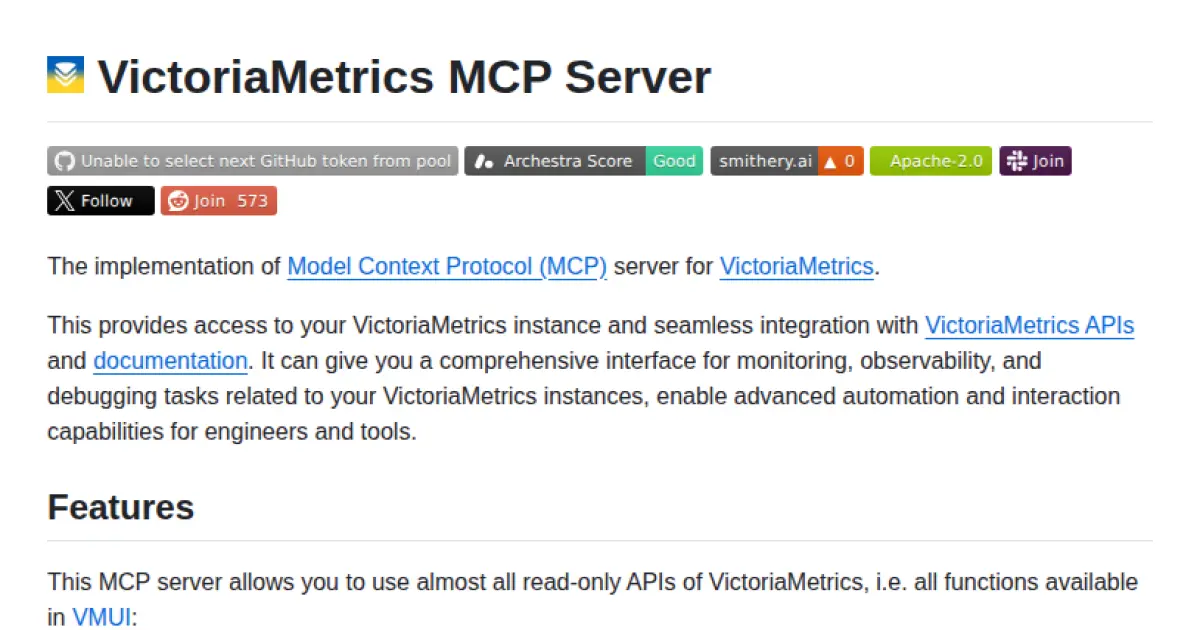
VictoriaMetrics MCP Server
Model Context Protocol server enabling advanced monitoring and observability for VictoriaMetrics.
VictoriaMetrics MCP Server implements the Model Context Protocol (MCP) to provide seamless integration with VictoriaMetrics, allowing advanced monitoring, data exploration, and observability. It offers access to almost all read-only APIs, as well as embedded documentation for offline usage. The server facilitates comprehensive metric querying, cardinality analysis, alert and rule testing, and automation capabilities for engineers and tools.
- ⭐ 87
- MCP
- VictoriaMetrics-Community/mcp-victoriametrics

metoro-mcp-server
Bridge Kubernetes observability data to LLMs via the Model Context Protocol.
Metoro MCP Server is an implementation of the Model Context Protocol (MCP) that enables seamless integration between Kubernetes observability data and large language models. It connects Metoro’s eBPF-based telemetry APIs to LLM applications such as the Claude Desktop App, allowing AI systems to query and analyze Kubernetes clusters. This solution supports both authenticated and demo modes for accessing real-time cluster insights.
- ⭐ 45
- MCP
- metoro-io/metoro-mcp-server
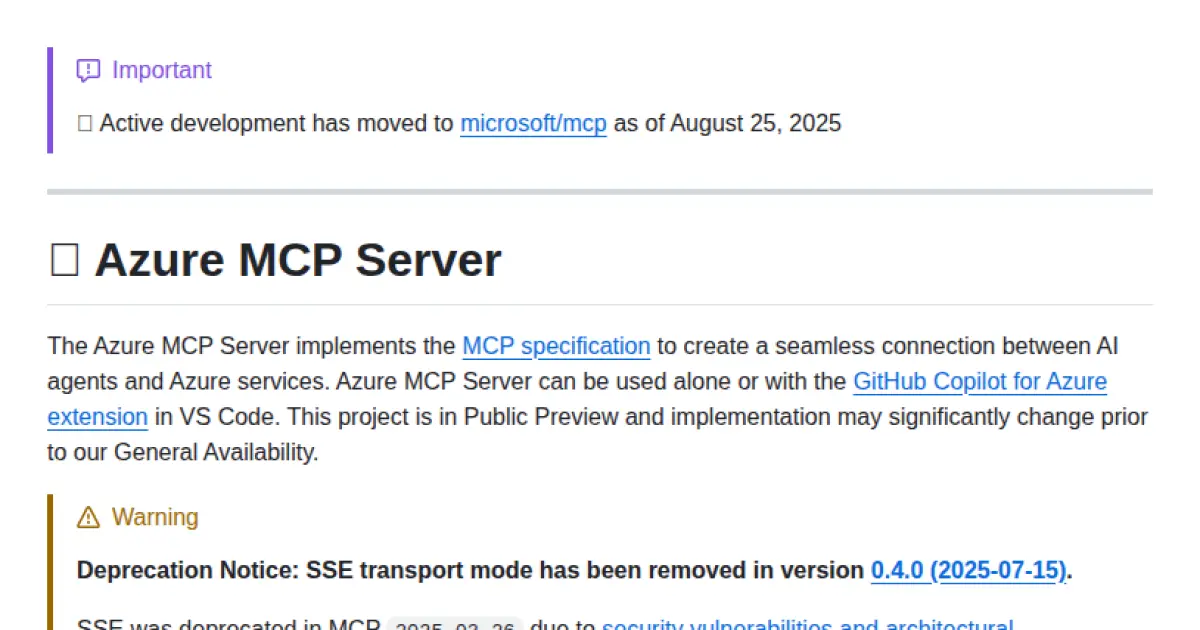
Azure MCP Server
Connect AI agents with Azure services through Model Context Protocol.
Azure MCP Server provides a seamless interface between AI agents and Azure services by implementing the Model Context Protocol (MCP) specification. It enables integration with tools like GitHub Copilot for Azure and supports a wide range of Azure resource management tasks directly via conversational AI interfaces. Designed for extensibility and compatibility, it offers enhanced contextual capabilities for agents working with Azure environments.
- ⭐ 1,178
- MCP
- Azure/azure-mcp
Dappier MCP Server
Real-time web search and premium data access for AI agents via Model Context Protocol.
Dappier MCP Server enables fast, real-time web search and access to premium data sources, including news, financial markets, sports, and weather, for AI agents using the Model Context Protocol (MCP). It integrates seamlessly with tools like Claude Desktop and Cursor, allowing users to enhance their AI workflows with up-to-date, trusted information. Simple installation and configuration are provided for multiple platforms, leveraging API keys for secure access. The solution supports deployment via Smithery and direct installation with 'uv', facilitating rapid setup for developers.
- ⭐ 35
- MCP
- DappierAI/dappier-mcp
Inspektor Gadget MCP Server
AI-powered Kubernetes troubleshooting via Model Context Protocol.
Inspektor Gadget MCP Server provides an AI-powered debugging and inspection interface for Kubernetes clusters. Leveraging the Model Context Protocol, it enables intelligent output summarization, one-click deployment of Inspektor Gadget, and automated discovery of debugging tools from Artifact Hub. The server integrates seamlessly with VS Code for interactive AI commands, simplifying Kubernetes troubleshooting and monitoring workflows.
- ⭐ 16
- MCP
- inspektor-gadget/ig-mcp-server
sentry-mcp
Remote MCP middleware for developer workflow and debugging tools.
sentry-mcp provides a remote Model Context Protocol server designed as middleware for Sentry's API, specifically optimized for human-in-the-loop coding agents and developer-oriented workflows. It enables integration with coding assistants like Cursor and Claude Code, offering both remote and stdio transports for varied environments, including self-hosted instances. The project also supports AI-powered search tools for querying events and issues, leveraging OpenAI API for natural language processing. Additionally, an Inspector tool is included for service testing and integration validation.
- ⭐ 424
- MCP
- getsentry/sentry-mcp
Didn't find tool you were looking for?